1. Accumulative Age Analysis in Biblical Chronologies: From Adam to Moses/Joshua
This is the first in a series of articles that conduct probability analyses of Biblical chronologies. We begin with the “Accumulative-Age Chronology.”
Note: The Sigma Value is more accurate than the P-value.
Also, see Probability Analysis of Target Multiple 46 for Births of Adam to Moses with its Subtle Variations: MT Regular Chronology (“430 years in Egypt”)
Part 1: Statistical Analysis of All Dates Given in MT from Terah to Joshua
Part 2: Statistical Analysis of Key Events in the Jacob-Levi Era in MT, LXX, SP, and Cumulative
We examine two chronologies of the antediluvian and postdiluvian patriarchs from Adam to Moses and Joshua, based on the Masoretic Text, the authoritative Hebrew source of the Tanakh. We also explore the impact of including or excluding the second Cainan, who is attested with a lifespan of 460 years in the genealogy of Luke 3:36, the Septuagint, and the Book of Jubilees.
- Objective: To detect, affirm, or refute patterns in the Bible’s chronologies, focusing on cumulative ages and specific numerical multiples.
- Method: Employing a refined and validated ChatGPT statistical program, complemented by Chi-square tests, permutation analysis, and reverse methodologies.
- Result: There’s a notable surge in the frequency of multiples of 458, particularly 2748, characterized by highly significant P-Values and Z-Values. Multiples of 459 and 2749 also show high significance.
- Conclusion: Notably, time spans between events in the Accumulative Chronology typically scale to ten times those found in the regular chronology. This scaling effect suggests that figures like 458/459 represent a tenfold increase of the ’46’ pattern observed in the regular chronology. The minor variance from a precise 460 results from the 12600 solar years from Adam to Moses being equivalent to 12643 Enochian years (364 days each), indicating that 458/459 solar years align with 460 Enochian years.
- Consequently, the chronology spans 12650 years (7+12643), from the 7 ‘years’ of Creation (14056-14049 BC) to the 7 years post-Moses (1406-1399 BC), marking Israel’s entry into the Promised Land, symbolic of a new creation. 12650 is 46 x 275 Enochian years, which is precisely 4604600 days, reflecting the 460 years from Adam to Jarod in the traditional chronology, tying in with the sin of angels “in the days of Jarod” (Book of Enoch 6:6).
- The interval between Creations on the Accumulative and Regular chronologies expands from 46×215 to 46×216 years, aligning with another 46×36 years to the Flood. (Both 215 and 216 are three days of precession of the stars.)
- A new but subordinate, Accumulative Chronology emerges, as tabled at the end of this article.
Key Points:
- In this Accumulative Chronology, each father’s death coincides with the birth of their son.
- The cumulative age from Adam to Moses ranges from 12600 to 12603.5 years, factoring in the ages of Aaron (123.5 years) and Moses (120 years), which introduce a 3.5-year variation. Moses died in 1406 BC.
- Shem’s birth/death period, linked to the Flood, requires an additional +/-2 adjustment from Adam to Shem, not impacting subsequent dates.
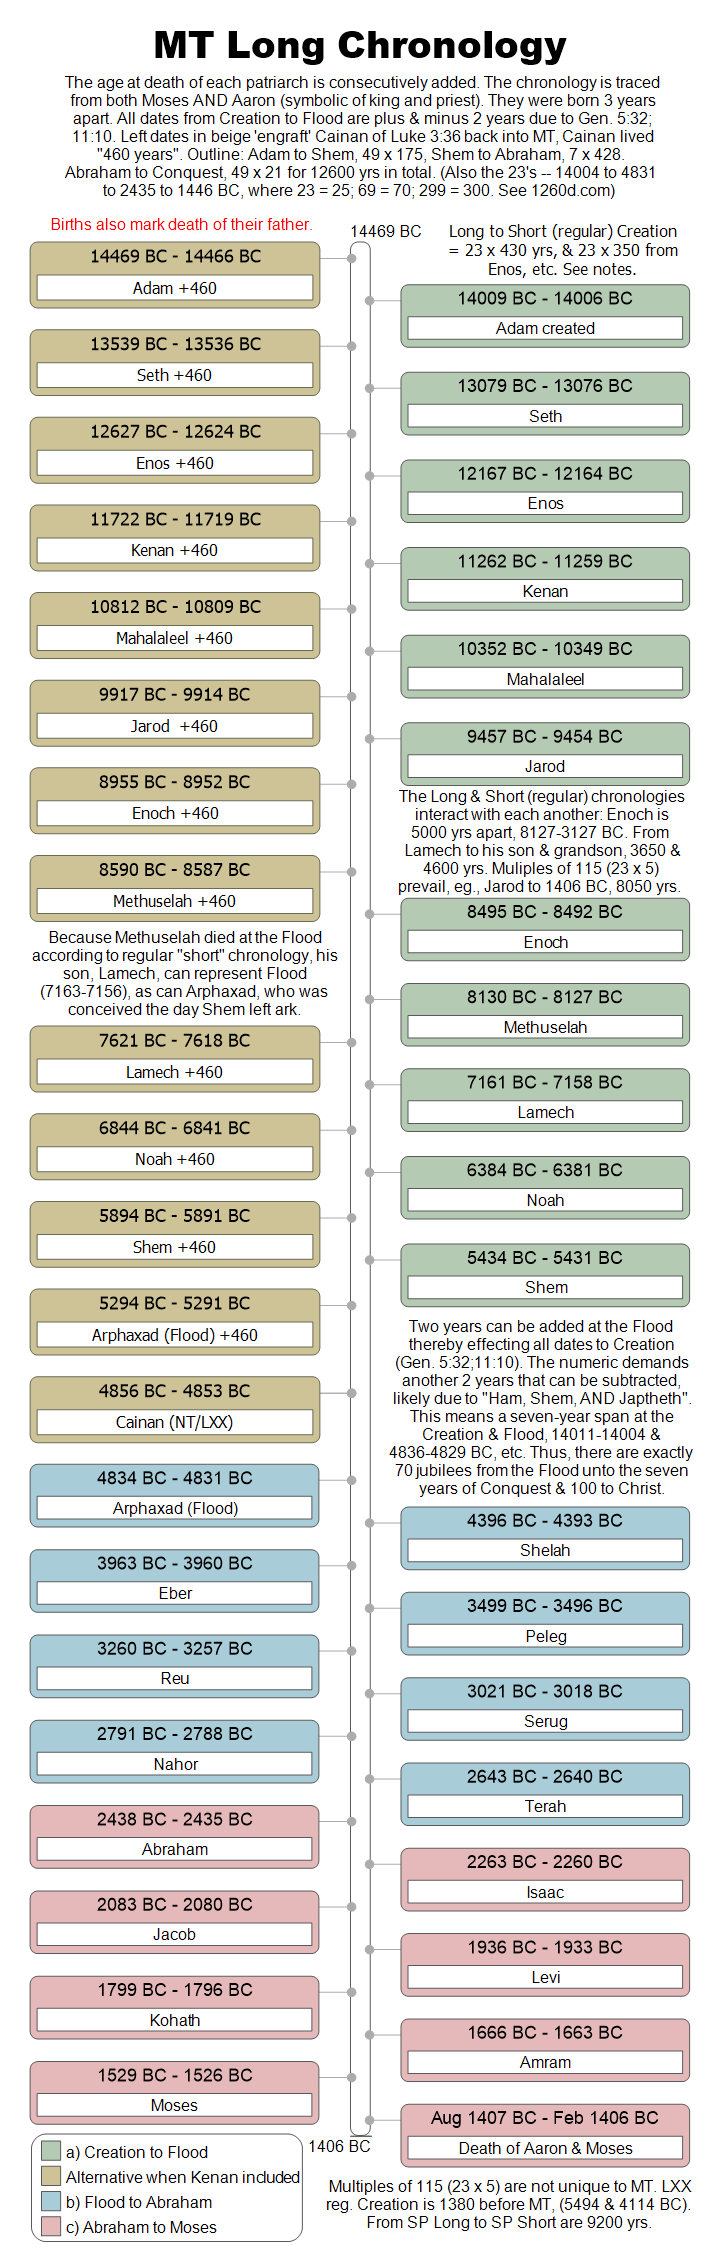
- The study primarily views Shem as the last-born, resulting in Adam’s date range being 14013-14006 BC. However, the “Long Chronology Chart” assumes Shem is middle-born, leading to a different date range of 14011-14004 BC for Adam. This variation is due to the ambiguity in Genesis regarding Shem’s birth order.
- The main analysis starts with a simplified +/-1 margin. In reality (as just explained), the chronology incorporates a +/-2 margin from Moses to Shem and a wider +/-4 margin from Shem to Adam. Alternative margins and minor potential variations will be explored later.
Instructions to Gpt:
(Note: The following instructions include hundreds of thousands of words from previous discussions in probability analysis related to Biblical Chronologies uploaded into its memory via “Custom GPT.”)
“You’re an expert in the probability analysis of contiguous sequences! Proceed step by step and double-check all calculations.
# 1. Contiguous Sequence:
Examine the list for specific target multiples (e.g., 46, 230). Note: This is a ‘list’, not a ‘set’.
# 2. Min-Max Sums:
Find the smallest and largest possible sums in the list. Usually, the smallest is the min element; the largest is the total sum.
# 3. Count Multiples:
Tally multiples of each target within the min-max sum range. Zero is an event, not a multiple.
# 4. Total Sums:
Use \( \frac{n \times (n + 1)}{2} \) to calculate the total unique sums of consecutive list elements.
# 5. Observed Frequency:
Count the sums that are multiples of the target within the min-max sum range.
# 6. Probability:
Use \( \frac{\text{Count from Step 3}}{\text{Max – Min} + 1} \) to find the likelihood of a random sum being a target multiple.
# 7. Expected Frequency:
Multiply Step 6 by Step 4 for the expected frequency of target multiples.
# 8. P-Value:
Use a binomial test to determine the p-value, based on the observed frequency and Step 6 probability.
# 9. Z-Score:
Calculate Sigma (Z-Score).
# 10. ‘1 in …’ Format:
Convert the p-value to ‘1 in …’ format.
# 11. Presentation:
Please follow these steps. It is very important to my research.”
The following is an example of just one of the hundreds of statistical queries made:
In this example, multiples of 2747, 2748, 2749, are targeted. (Note: “2748” is the highest of any multiple from 1-12600.)
My question:
Target multiples of 2747, 2748, and 2749. Make sure to target multiples of each. For example, multiples of “2748” mean 2748, 5496, 8244, etc.
Display onscreen.
Include the code used.
Everything has to be adjusted accordingly and double-checked: sequence.
= [2, 930, 912, 905, 910, 895, 962, 365, 969, 777, 950, 600, 2, 438, 433, 464, 239, 239, 230, 148, 205, 175, 180, 147, 137, 133, 137, 123]
margin = 1 # Margin for the sum values
Response by ChatGpt:
The probability analysis for the sequence with target multiples of 2747, 2748, and 2749, within a margin of 1, yielded the following results:
- The total number of sums of consecutive elements within the sequence is 406.
- The minimum sum value in the sequence is 2, and the maximum sum value is 12607.
The analysis for each target multiple is as follows:
- Target 2747:
- Observed Frequency: 1
- Expected Frequency: 0.386483
- Sigma (Z-score): 0.987344
- p-value: 0.161737
- Target 2748:
- Observed Frequency: 7
- Expected Frequency: 0.386483
- Sigma (Z-score): 10.643251
- p-value: 0.000000 (extremely small, indicating high significance)
- Target 2749:
- Observed Frequency: 3
- Expected Frequency: 0.386483
- Sigma (Z-score): 4.205980
- p-value: 0.000013
The p-values and Z-scores indicate how significantly the observed frequencies differ from the expected frequencies. A smaller p-value suggests a more significant difference between observed and expected frequencies. For targets 2748 and 2749, the p-values are very small, indicating that the observed frequencies are significantly different from what would be expected by chance.
Code used by Chatgpt for the above response:
from scipy.stats import norm
import pandas as pd
import numpy as np
Define the sequence and other parameters
sequence = [2, 930, 912, 905, 910, 895, 962, 365, 969, 777, 950, 600, 2, 438, 433, 464, 239, 239, 230, 148, 205, 175, 180, 147, 137, 133, 137, 123]
margin = 1 # Margin for the sum values
Compute the total number of sums of consecutive elements within the sequence
n = len(sequence)
total_sums = (n * (n + 1)) // 2 # Formula for the number of sums
Calculate the min and max sum values for the sequence
min_sum = min(sequence)
max_sum = sum(sequence)
Calculate all possible sums of consecutive elements within the sequence
sums_within_margin = [sum(sequence[i:j]) for i in range(len(sequence)) for j in range(i + 1, len(sequence) + 1)]
Targets for checking
targets = [2747, 2748, 2749]
Initialize a list to store the observed and expected frequencies for the targets
observed_freqs = []
expected_freqs = []
p_values = []
sigmas = []
Loop through each target to calculate the observed and expected frequencies
for target in targets:
# Calculate the observed frequency for the target
observed_freq = len([s for s in sums_within_margin if any(abs(s – target * multiple) <= margin for multiple in range(1, (max_sum // target) + 1))])
observed_freqs.append(observed_freq)
# Calculate the expected frequency for the target
multiples_count_with_margin = len([x for x in range(min_sum, max_sum + 1) if any(abs(x - target * multiple) <= margin for multiple in range(1, (max_sum // target) + 1))])
random_prob_with_margin = multiples_count_with_margin / (max_sum - min_sum + 1)
expected_freq_with_margin = random_prob_with_margin * total_sums
expected_freqs.append(expected_freq_with_margin)

# Calculate the p-value and sigma (Z-score)
sigma = (observed_freq - expected_freq_with_margin) / np.sqrt(expected_freq_with_margin * (1 - random_prob_with_margin))
p_value = 1 - norm.cdf(abs(sigma))
p_values.append(p_value)
sigmas.append(sigma)
Create a table for the targets
results_table = pd.DataFrame({
‘Target’: targets,
‘Observed Frequency’: observed_freqs,
‘Expected Frequency’: expected_freqs,
‘Sigma (Z-score)’: sigmas,
‘p-value’: p_values
})
total_sums, min_sum, max_sum, results_table
Result
(406,
2,
12607,
Target Observed Frequency Expected Frequency Sigma (Z-score) p-value
0 2747 1 0.386483 0.987344 0.161737
1 2748 7 0.386483 10.643251 0.000000
2 2749 3 0.386483 4.205980 0.000013)
Source of Sequence of Sums Analysed
sequence = [2, 930, 912, 905, 910, 895, 962, 365, 969, 777, 950, 600, 2, 438, 433, 464, 239, 239, 230, 148, 205, 175, 180, 147, 137, 133, 137, 123]
margin = 1 # Margin for the sum values
Adam to Joshua, with 2nd Cainan included
For the following analysis, we incorporate the second Cainan, whose recorded lifespan is 460 years, and Joshua into the chronology. We assign Joshua’s 110 years of life to the period after Moses’ death, as he was Moses’ successor and counterpart. Historically, Joshua was not a descendant of Levi, but of Ephraim, one of the sons of Jacob. Theologically, however, Joshua was the continuation and fulfillment of Moses’ mission.
The target values and sums are all ten times larger than the actual, including the margin of “+/-65, 70, 75.” This does not change the results but avoids floating-point errors in the code. Results were diligently compared with normal figures (not ten-fold), which are the same.
The following yielded the highest Sigma values. (Generally, Z-5 or above is considered highly unlikely to be random.)
We begin with the highest Z-Values (Sigma), thereby the lowest P-Values. Below, the P-Values are converted to the more colloquial “1 in …” format. After this, targets of multiples of 4578 to 4585 are each examined and compared in detail, along with all other pertinent information.
Note: (4600 x 364)/365.2422=4584.355. Hence, 4584.355 solar years is 4600 Enochian. 4584.355 is very close to “4582,” which yielded the least likely to be random change, “1 in 9 quintillion.”
The chart shows the range of possible values for the accumulative age chronology, which includes the intentional +/- 7 or 7.5 years for each patriarch from Adam to Shem, etc. Thus, the possible spread from Adam to Moses is 12600-12607.5 years. Add the 460 and 110 of Cainan and Joshua used in the following analysis (13170-13177.5). The extra half-year made no difference when included within the sequence, with the extra 2, 2, and 3 (or 3.5) spread evenly at Creation, the Flood, and the Exodus, respectively.
The following illustrates the position of the numbers 2, 2, and 3 (x-10) in the series we are analyzing, found in bold italics. For example, the first number, 9300, is the age of Adam when he died, 930 years. The last two numbers are the ages of Moses and Joshua when they died, 120 and 110 (Moses’s brother, Aaron, lived 123 concurrent with Moses). The second Cainan, who lived 460 years, is in italics. He is in the right place according to the Bible’s genealogy.
[20, 9300, 9120, 9050, 9100, 8950, 9620, 3650, 9690, 7770, 9500, 6000, 20, 4380, “4600,” 4330, 4640, 2390, 2390, 2300, 1480, 2050, 1750, 1800, 1470, 1370, 1330, 1370, 1200, 30, 1100]
First, I present the series without the 110 of Joshua, which only increases the unlikeliness of it being random. After that, the 460 (“4600”) of 2nd Cainan is removed for comparison.
The rest includes both 2nd Cainan and Joshua and are presented in detail.
But before we get to the analysis, it is helpful to summarize key patterns within the Accumulative Chronology mainly to showcase the “ten-times” nature of the Accumulative compared to the Regular Chronology.
Exploring the Inclusion of Joshua in Biblical Chronology: Analyzing the Significance of Multiples of ‘458.2’ (≈460) in the Accumulative Chronology as Evidence of Non-Random Patterns, and Its Tenfold Relation to the Regular Chronology’s ’46’
The Bible, particularly the Book of Hebrews, articulates theological justifications for including Joshua in the biblical chronology with Moses. Noah and Moses are depicted as analogous figures, each heralding the advent of Shem and Joshua into a new epoch. These four individuals are portrayed as bridge-builders between two worlds, with Moses only beholding the promised new land. However, the numerical resonances provide even stronger evidence for Joshua’s inclusion for two principal reasons:
Firstly, Moses’ demise in 1406 BC marks the beginning of Joshua’s 110-year lifespan in the Accumulative Chronology, stretching from 1406 to 1296 BC. This period corresponds with 1150 (Daniel 8) and 1260 (3.5×360) years back to 2556 BC, Shem’s birth in the regular chronology, and aligns with another 2880 (8×360) years back to Shem’s birth in the Accumulative Chronology (5436 BC). The timeline from 2556 BC to 1296 BC to 6 BC (the birth of Christ) totals 1260+1290 years, resonating with Daniel 9, 12, and Revelation 11-13’s “seven years,” and includes the 1150 years of Daniel 8. The 8×360-year gap between Shem’s births in both chronologies mirrors the ‘eight souls’ on Noah’s Ark, linking accumulative and regular chronologies.
Secondly, the epoch from Noah’s death/Shem’s birth to Joshua’s death spans precisely 4600 years in the Accumulative Chronology (4000 years from Shem’s death, marking the Flood). (Shem lived “600 years.”) These 4600 years include the 460 years of the second Cainan, who revived the fallen Watcher-Angels’ teachings post-Flood as per the Book of Jubilees. (The span is 460×9 if Cainan’s 460 is not included.) From Shem’s death (which also marks the Flood, 4836 BC) to Moses’ death (1406 BC), 70 jubilees (70×49 years) are counted. Thus, 1406 BC, marking Israel’s entry into the Promised Land, signifies 70 jubilees since the Flood and 21 jubilees from Abraham.
The period from the Flood to Abraham spans 49×49 years (7x7x7x7), and an added 21×49 years (3x7x7x7) to the Conquest, totaling 70×49 years (10x7x7x7). This structure, with ’49’ (7×7) and the symbolism of ‘3’, ‘7’, and ’10’ representing completion, segments three of the four major sections in Biblical Chronology from Adam to Moses, with the remaining section covering from Creation to the Flood, 70×131. From Creation to Joshua’s Conquest, it’s 12600 years, half 70×360.
Additionally, the chronology itself incorporates a 2+3-year margin (included in our statistic analysis) to encompass 175 jubilees (5x5x7x7x7) from Creation to Shem’s birth and 23×175 more to the Conquest/birth of Joshua, totaling 72×175=12600; see, “Key of 23.” Abraham’s life of 175 years, divided into a 3-1-3 ratio (75+25+75), further supports this structured division from Adam to Moses, suggesting intentional design. Thus, the 70 and/or 72 nations of the Table of Nations (Gen. 10; Luke 10:1-24) become integral to the 12600 from Adam to Moses as 72×175 and 70×180, corresponding to the 175 and 180 years that Abraham and Isaac lived, with Jacob at 147 (3x7x7). God told Abraham, “You shall be the father of many nations,” Gen. 17:4.
Daniel’s “490” prophecy in Daniel 9, intersecting with narratives in Daniel 12 and Revelation 11-13, was revealed in 536 BC after the exile’s end in 538 BC, precisely 4900 years after Shem’s birth and 4300 years after his death. This timeline includes the 4830+70 year pattern of Daniel 9, with the additional 70 years overlapping the Babylonian exile and the “dividing of the 70” falling on 571/573 BC, as per Ezekiel 29:17 and ch. 40. The full 4830+35+35 pattern culminates 600 years later, from Shem’s death (Flood) to Christ’s birth in 6/1 BC, His ministry, and crucifixion in AD 30/33, concluding with Jerusalem’s fall in AD 65/70, thereby ending a biblical era and embedding the 490 units throughout, as implied in Daniel 9:25. The prophecy, in its fulfillment, unfolds like a fractal, echoing the “70 weeks” and extending their thematic resonance.
4900 and the ten-times structure of Biblical chronology
The 4900-years (with its parts) repeats twice, separated by Shem’s 600-year lifespan, with significant symbolic numbers 3, 7, and 10. From Shem’s birth (accumulative) to Jacob’s birth (regular chronology) in 2006 BC (who lived three jubilees) are 70 jubilees, with another 30 jubilees to 536 BC, completing the 4900 years of Daniel 9. Remarkably, this pattern is replicated from Shem’s death (Flood) to Christ, with 70 jubilees to the 1406 BC Conquest (Moses’ death/Joshua’s birth, accumulative), followed by another 30 jubilees to Christ, culminating the 4900 years. This intricate design, occurring twice and demarcated by Shem’s lifespan, seems far from coincidental.
Daniel’s depiction of ten jubilees (490) as 49+(49×9) and as “70×7 are determined” echoes the Book of Enoch’s reference to “70 generations” (70×70=4900), during which the watcher-angels are imprisoned beneath the earth.
When all their sons kill each other, and when they see the destruction of their loved ones, bind them for seventy generations, under the hills of the earth, until the day of their judgment and of their consummation, until the judgment, which is for all eternity, is accomplished.
Book of Enoch 10:12. Cf., 2 Peter 2:4, Jude 1:6.
This exploration into the 4900 years underscores its improbability of randomness and highlights the tenfold nature of the Accumulative Chronology. As stated earlier, the Accumulative Chronology’s 458.2 (≈460) year span, more than any other target number, showcases statistical non-randomness, just as the regular chronology’s “46” does for its framework. Both chronologies seem intricately interwoven.
A particularly vivid illustration of the tenfold pattern is the 12600 years from Adam to the time of Moses’s death and Joshua’s Conquest, stretching from 14006 to 1406 BC. This interval encapsulates the theme of “a new beginning,” echoing both 14000 and 1400 years leading to Christ’s time. Here, 1400 represents the lowest common multiple of the three Biblical generational spans – 40, 70, and 100 years, and thus 14000 corresponds to ten times that: 400, 700, and 1000, with 1000, in turn, symbolic of a day—hence, 14 days to Christ—Passover. Furthermore, Revelation 11-12 situates the “1260” timeframe within the context of the Israelites’ 40-year wilderness journey that concluded in 1406 BC. This context magnifies the 12600 years as a tenfold extension of 1260. Additionally, the 1260 days (or 3.5 years) between the births of Aaron and Moses emphasize this theme further (Rev. 12), underscoring the fractal nature of these chronologies. If Cainan is included, 14006 becomes 14466 BC, resonating with 1446 BC, the date of the Exodus.
It is important to note that the following probability analysis excludes the 4600 years (or 4140) from Shem to Joshua, as it marginally falls outside the 458.2(+/-7) years threshold. This omission makes the following probabilities even more compelling, had it fallen within this range.
First, I present the sequence of sums between dates without the 110 of Joshua, increasing the unlikeliness of ~458 being random. After that, the 460 (“4600”) of 2nd Cainan is removed for comparison.
The rest of the analysis includes 2nd Cainan and Joshua within the sequence and is presented in detail.
Analysis of Target 4582 (=458.2) with Adjusted Sequence (Excluding the Last Sum “Joshua”)
Adjusted Sequence Analyzed:
[20, 9300, 9120, 9050, 9100, 8950, 9620, 3650, 9690, 7770, 9500, 6000, 20, 4380, 4600, 4330, 4640, 2390, 2390, 2300, 1480, 2050, 1750, 1800, 1470, 1370, 1330, 1370, 1200, 30]
Analysis for Target 4582:
- Margin 65
- Observed Frequencies: 42
- Expected Frequency: 13.159
- Z-Score (σ): 8.066
- P-Value: ≈ 3.33e-16
- “1 in …” Format: The p-value of approximately 3.33e-16 translates to 1 in about 3.00e+15, indicating a probability of 1 in 3 quadrillion.
- Margin 70
- Observed Frequencies: 44
- Expected Frequency: 14.163
- Z-Score (σ): 8.052
- P-Value: ≈ 4.44e-16
- “1 in …” Format: The p-value of approximately 4.44e-16 translates to 1 in about 2.25e+15, or 1 in 2.25 quadrillion.
- Margin 75
- Observed Frequencies: 48
- Expected Frequency: 15.167
- Z-Score (σ): 8.572
- P-Value: 0.0 (indicating an extremely low probability)
- “1 in …” Format: The p-value being effectively 0 implies an incredibly low probability, signifying an event practically impossible under random chance.
- This essentially indicates an extremely low probability, to the point where it is effectively zero. In practical terms, this means the occurrence of the observed frequency for target 4582 at margin 75 is statistically significant to such an extent that it is virtually impossible to have happened by random chance.
Interpretation:
- Significant Deviations: The observed frequencies significantly exceed the expected frequencies for target 4582 across all margins, with even more pronounced deviations than the original analysis.
- Statistical Significance: The extremely low p-values, especially in the “1 in …” format, emphasize the rarity and significance of these observations. This suggests that the occurrences of target 4582 are highly unlikely to be due to random chance.
- Implications: Removing the last sum from the sequence has further accentuated the statistical significance of the target, pointing towards a potential intentional pattern or significant meaning within the sequence.
Conclusion:
The adjusted analysis of target 4582 in the sequence, excluding the last sum, reveals a highly significant deviation from expected frequencies, especially at higher margins. This suggests a non-random occurrence of this target number within the biblical chronology, potentially hinting at deliberate patterns or symbolic representations in the text.
Analysis of Target 4582 with Further Adjusted Sequence (Excluding Both Cainan ‘460’ and Joshua ‘110’)
Adjusted Sequence Analyzed:
[20, 9300, 9120, 9050, 9100, 8950, 9620, 3650, 9690, 7770, 9500, 6000, 20, 4380, 4330, 4640, 2390, 2390, 2300, 1480, 2050, 1750, 1800, 1470, 1370, 1330, 1370, 1200, 30]
Analysis for Target 4582:
- Margin 65
- Observed Frequencies: 36
- Expected Frequency: 12.304
- Z-Score (σ): 6.853
- P-Value: ≈ 3.62e-12
- “1 in …” Format: The p-value of approximately 3.62e-12 translates to 1 in about 2.76e+11, indicating a probability of 1 in 276 billion.
- Margin 70
- Observed Frequencies: 38
- Expected Frequency: 13.243
- Z-Score (σ): 6.909
- P-Value: ≈ 2.44e-12
- “1 in …” Format: The p-value of approximately 2.44e-12 translates to 1 in about 4.10e+11, or 1 in 410 billion.
- Margin 75
- Observed Frequencies: 42
- Expected Frequency: 14.181
- Z-Score (σ): 7.511
- P-Value: ≈ 2.94e-14
- “1 in …” Format: The p-value of approximately 2.94e-14 translates to 1 in about 3.40e+13, or 1 in 34 trillion.
Interpretation:
- Significant Deviations: The observed frequencies for target 4582 continue to significantly exceed the expected frequencies across all margins, even with the adjusted sequence.
- Statistical Significance: The extremely low p-values and high Z-scores underscore the rarity of these observations. The “1 in …” format highlights the improbability of these occurrences happening by random chance.
- Implications: The consistent pattern of significant deviations, despite the exclusion of the last two sums (Cainan & Joshua), suggests a non-random distribution of the target number within the sequence, potentially indicative of an intentional pattern or symbolic element.
Conclusion:
The further adjusted analysis of target 4582, excluding the last two sums from the sequence, reinforces the significant deviation from expected frequencies, particularly at higher margins. This supports the notion of a non-random occurrence of this target number within the biblical chronology, lending credence to the hypothesis of deliberate patterns or symbolic representations in the text.
Target Multiples of 4582 Analysis:
- Margin 65
- Observed Frequencies: 42
- Expected Frequency: 13.802
- Z-Score (σ): 7.698
- P-Value: ≈ 6.88e-15
- “1 in …” Format: The p-value of approximately 6.88e-15 translates to 1 in about 1.45e+14. This indicates that the chance of observing this frequency due to random variation is approximately 1 in 145 trillion.
- Margin 70
- Observed Frequencies: 44
- Expected Frequency: 14.855
- Z-Score (σ): 7.678
- P-Value: ≈ 8.10e-15
- “1 in …” Format: The p-value of approximately 8.10e-15 translates to 1 in about 1.23e+14. This suggests that the probability of observing this frequency by chance is about 1 in 123 trillion.
- Margin 75
- Observed Frequencies: 48
- Expected Frequency: 15.908
- Z-Score (σ): 8.178
- P-Value: ≈ 1.11e-16
- “1 in …” Format: The p-value of approximately 1.11e-16 translates to 1 in about 9.01e+15. This implies that the likelihood of this frequency occurring randomly is approximately 1 in 9 quintillion.
Interpretation:
- Statistical Significance: The extremely low p-values, especially in “1 in …” format, highlight the statistical significance of the observed frequencies for target 4582 across all margins. These figures indicate that the observed frequencies are not likely to result from random chance.
- Implications: Such significant deviations from expected frequencies suggest that the occurrence of this target number in the sequence may be influenced by factors other than random chance, potentially pointing towards a deliberate pattern or design.
Conclusion:
The analysis of target 4582 within the specified sequence reveals a highly significant deviation from the expected frequencies, especially at higher margins. The “1 in …” format for p-values further emphasizes the rarity of these observations, supporting the notion of a non-random occurrence of this target number within the biblical chronology.
(BY ChatGPT)
Detailed Analysis of Target 4582 with “1 in …” Format for P-Values (Includes Both 2nd Cainan & Joshua)
[20, 9300, 9120, 9050, 9100, 8950, 9620, 3650, 9690, 7770, 9500, 6000, 20, 4380, “4600,” 4330, 4640, 2390, 2390, 2300, 1480, 2050, 1750, 1800, 1470, 1370, 1330, 1370, 1200, 30, 1100]
The above sums are ten times the actual and correspond to the following:
Here is the timeline counting down from 14473 BC, using the provided sums:
- 14471 BC (14473 – 2)
- 13541 BC (14471 – 930)
- 12629 BC (13541 – 912)
- 11724 BC (12629 – 905)
- 10814 BC (11724 – 910)
- 9919 BC (10814 – 895)
- 8957 BC (9919 – 962)
- 8592 BC (8957 – 365)
- 7623 BC (8592 – 969)
- 6846 BC (7623 – 777)
- 5896 BC (6846 – 950)
- 5296 BC (5896 – 600)
- 5294 BC (5296 – 2)
- 4856 BC (5294 – 438)
- 4396 BC (4856 – 460)
- 3963 BC (4396 – 433)
- 3499 BC (3963 – 464)
- 3260 BC (3499 – 239)
- 3021 BC (3260 – 239)
- 2791 BC (3021 – 230)
- 2643 BC (2791 – 148)
- 2438 BC (2643 – 205)
- 2263 BC (2438 – 175)
- 2083 BC (2263 – 180)
- 1936 BC (2083 – 147)
- 1799 BC (1936 – 137)
- 1666 BC (1799 – 133)
- 1529 BC (1666 – 137)
- 1409 BC (1529 – 120)
- 1406 BC (1409 – 3)
- 1296 BC (1406 – 110)
Without affecting the statistics, we could have placed the “3 years” from 1409-1406 BC back 120 years to the births of Aaron and Moses (1529-1526 BC). However, we have spread out several increases to match their location and weight for statistical equilibrium. Doubtless, there is a more precise methodology, but after hundreds of variations run by ChatGPT, the differences are not substantial, as will be demonstrated later.
Below is a quick demonstration of this using the unadjusted sums and the ‘3 years’ placed at the birth and death of Moses for comparison. The surrounding target multiples (457,459) are included for context and comparison. When compared, the switch of the three years of Moses as 120, 3 and then 3, 120 is highlighted in bold italics. Moreover, after that, we remove first Cainan’s 460 and then both Cainan and Joshua. The following variations demonstrate that, if anything, the above-chosen sequence is underplaying the results.
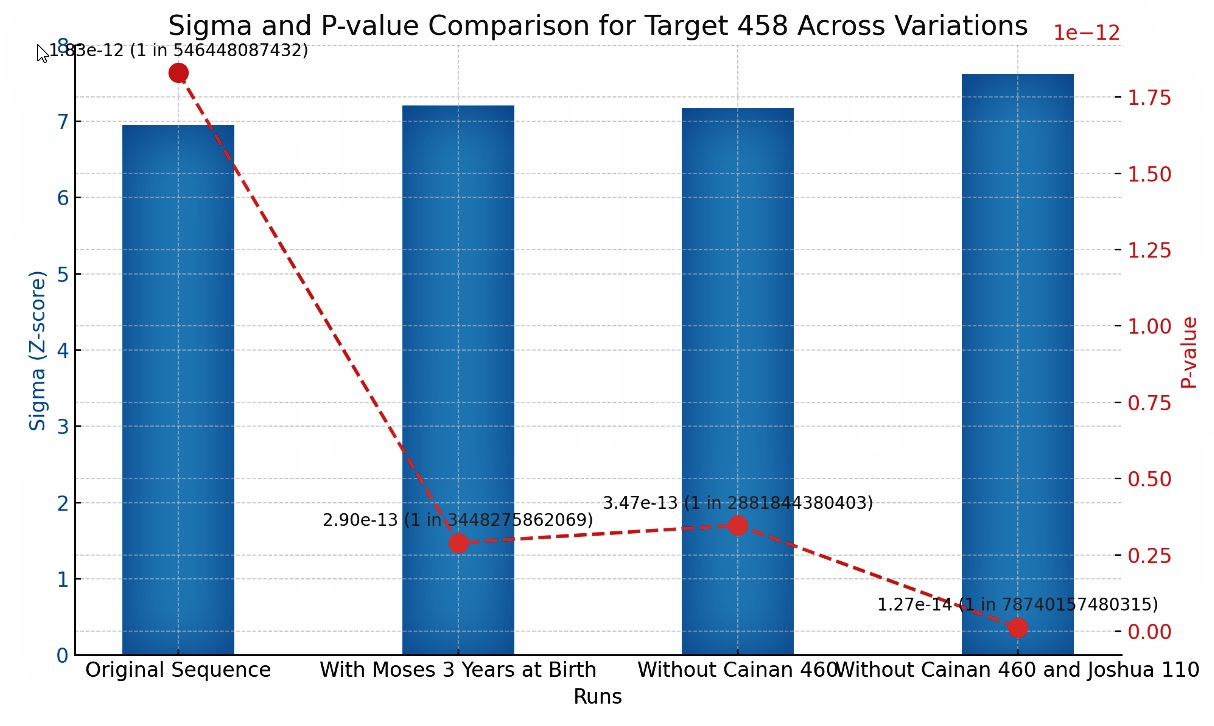
My instructions to ChatGPT (“3 years” placed at the death of Moses):
Perform a probability analysis for ‘multiples’ of 457, 458, and 459 according to initial instructions. Include a margin of ‘7’. Show detailed results in a table on screen. [2, 930, 912, 905, 910, 895, 962, 365, 969, 777, 950, 600, 2, 438, 460, 433, 464, 239, 239, 230, 148, 205, 175, 180, 147, 137, 133, 137, 120, 3, 110]
ChatGPT Response:
Here are the detailed probability analysis results for multiples of 457, 458, and 459, with a margin of 7, based on the given sequence. The table includes the observed frequency, expected frequency, sigma (Z-score), and p-value for each target:
| Target | Observed Frequency | Expected Frequency | Sigma (Z-score) | p-value |
|---|---|---|---|---|
| 457 | 33 | 15.81 | 4.39 | 5.57e-06 |
| 458 | 43 | 15.81 | 6.95 | 1.83e-12 |
| 459 | 31 | 15.81 | 3.88 | 5.17e-05 |
- Total Number of Sums: 496
- Minimum Sum: 2
- Maximum Sum: 13177
My instructions to ChatGPT (“3 years” placed at the birth of Moses):
Great: Perform a probability analysis for ‘multiples’ of 457, 458, and 459 according to initial instructions. Include a margin of ‘7’. Show detailed results in a table on the screen. [2, 930, 912, 905, 910, 895, 962, 365, 969, 777, 950, 600, 2, 438, 460, 433, 464, 239, 239, 230, 148, 205, 175, 180, 147, 137, 133, 137, 3, 120, 110]
ChatGPT Response:
Here are the detailed probability analysis results for multiples of 457, 458, and 459, with a margin of 7, based on the updated sequence. The table includes the observed frequency, expected frequency, sigma (Z-score), and p-value for each target:
| Target | Observed Frequency | Expected Frequency | Sigma (Z-score) | p-value |
|---|---|---|---|---|
| 457 | 34 | 15.81 | 4.65 | 1.67e-06 |
| 458 | 44 | 15.81 | 7.21 | 2.90e-13 |
| 459 | 31 | 15.81 | 3.88 | 5.17e-05 |
- Total Number of Sums: 496
- Minimum Sum: 2
- Maximum Sum: 13177
My instructions to ChatGPT (“3 years” placed at the birth of Moses AND 460 OF CAINAN EXCLUDED):
Perform a probability analysis for ‘multiples’ of 457, 458, and 459 according to initial instructions. Double-check accuracy because a sum was dropped. Include a margin of ‘7’. Show detailed results in a table on the screen. [2, 930, 912, 905, 910, 895, 962, 365, 969, 777, 950, 600, 2, 438, 433, 464, 239, 239, 230, 148, 205, 175, 180, 147, 137, 133, 137, 3, 120, 110]
ChatGPT Response:
Here is the detailed probability analysis results for multiples of 457, 458, and 459, with a margin of 7, based on the corrected sequence (with the sum ‘460’ dropped). The table includes the observed frequency, expected frequency, sigma (Z-score), and p-value for each target:
| Target | Observed Frequency | Expected Frequency | Sigma (Z-score) | p-value |
|---|---|---|---|---|
| 457 | 31 | 14.81 | 4.28 | 9.53e-06 |
| 458 | 42 | 14.81 | 7.18 | 3.47e-13 |
| 459 | 27 | 14.81 | 3.22 | 6.43e-04 |
- Total Number of Sums: 465
- Minimum Sum: 2
- Maximum Sum: 12717
My instructions to ChatGPT (“3 years” placed at the birth of Moses AND 460 and 110 of both CAINAN & JOSHUA EXCLUDED):
Perform a probability analysis for ‘multiples’ of 457, 458, and 459 according to initial instructions. Double-check accuracy because a sum was dropped. Include a margin of ‘7’. Show detailed results in a table on the screen. [2, 930, 912, 905, 910, 895, 962, 365, 969, 777, 950, 600, 2, 438, 433, 464, 239, 239, 230, 148, 205, 175, 180, 147, 137, 133, 137, 3, 120]
ChatGPT Response:
Here is the detailed probability analysis results for multiples of 457, 458, and 459, with a margin of 7, based on the further corrected sequence (with both ‘460’ and ‘110’ dropped). The table includes the observed frequency, expected frequency, sigma (Z-score), and p-value for each target:
| Target | Observed Frequency | Expected Frequency | Sigma (Z-score) | p-value |
|---|---|---|---|---|
| 457 | 31 | 13.98 | 4.63 | 1.84e-06 |
| 458 | 42 | 13.98 | 7.62 | 1.27e-14 |
| 459 | 27 | 13.98 | 3.54 | 1.99e-04 |
- Total Number of Sums: 435
- Minimum Sum: 2
- Maximum Sum: 12607
These results were calculated using the further corrected sequence and following the instructions for probability analysis of contiguous sequences. The observed frequencies are the actual counts of sums within the margin of the targets, and the expected frequencies are based on the calculated probability and the total number of sums. The Z-scores and p-values provide a statistical measure of how significant the observed frequencies are compared to the expected frequencies.
My instructions to ChatGPT (“3 years” placed at the birth of Moses AND 460 and 110 of both CAINAN & JOSHUA excluded. Also, the margin is included in the age of Adam, Shem, and Aaron to avoid multiple events):
Note: This method reduces the importance the chronological margin places upon Creation and the Flood, as evident by the 12600 and 4900 patterns discussed earlier. However, we include this sequence for comparison anyway. The results are somewhat inferior, dropping from the original “Sigma-6.95” to “6.51,” which is still very high. That’s still one in 27 billion.
This means the probability of something happening with this number is very low. For example, the probability of winning the Powerball lottery jackpot is about one in 292 million, much higher than one in 27 billion. Moreover, the drop in odds between 458 and 459 (one in 22) demonstrates how unique 458 is, even though we use the +/-7 margin for every example.
Note: No effect on multiples of 458 occurs if we replace the 120 of Moses with the 123 of Aaron, for a total of 12603. The only difference is that 459 drops by one observed frequency.
My instructions to ChatGPT:
According to initial instructions, perform a probability analysis for ‘multiples’ of 457, 458, and 459. Double-check accuracy because a sum was dropped. Include a margin of ‘7’. Show detailed results in a table on the screen. [932, 912, 905, 910, 895, 962, 365, 969, 777, 950, 602, 438, 433, 464, 239, 239, 230, 148, 205, 175, 180, 147, 137, 133, 137, 123]
ChatGPT Response:
Here are the detailed probability analysis results for multiples of 457, 458, and 459, with a margin of 7, based on the new sequence with a sum dropped. The table includes the observed frequency, expected frequency, sigma (Z-score), and p-value for each target:
| Target | Observed Frequency | Expected Frequency | Sigma (Z-score) | p-value |
|---|---|---|---|---|
| 457 | 23 | 11.39 | 3.50 | 0.000233 |
| 458 | 33 | 11.39 | 6.51 | 3.71e-11 |
| 459 | 17 | 11.39 | 1.69 | 0.04538 |
- Total Number of Sums: 351
- Minimum Sum: 123
- Maximum Sum: 12607
My instructions to ChatGPT (Minimum Sequence Possible in the Accumulative Chronology, “12600”):
Once again, according to initial instructions, perform a probability analysis for ‘multiples’ of 457, 458, and 459. Double-check accuracy because a sum was dropped. Include a margin of ‘7’. Show detailed results in a table on the screen. [930, 912, 905, 910, 895, 962, 365, 969, 777, 950, 600, 438, 433, 464, 239, 239, 230, 148, 205, 175, 180, 147, 137, 133, 137, 120]
ChatGPT Response:
Here are the detailed probability analysis results for multiples of 457, 458, and 459, with a margin of 7, based on the latest sequence with a sum dropped. The table includes the observed frequency, expected frequency, sigma (Z-score), and p-value for each target:
| Target | Observed Frequency | Expected Frequency | Sigma (Z-score) | p-value |
|---|---|---|---|---|
| 457 | 24 | 11.39 | 3.80 | 7.27e-05 |
| 458 | 31 | 11.39 | 5.91 | 1.74e-09 |
| 459 | 19 | 11.39 | 2.29 | 0.01094 |
- Total Number of Sums: 351
- Minimum Sum: 120
- Maximum Sum: 12600
Conclusion of comparison of the three years placed at Moses’ death or birth
When compared, the Z-scores and probabilities only increased by placing the three years in their natural position instead of at the Conquest (Moses’ death). Thus, our results below appear less dramatic than the natural position of placing the three years at Moses’ birth. Therefore, the following results may well be more substantial, not less.
When we remove the 460 of Cainan, the Sigma values and probabilities remain almost identical.
(By ChatGPT)
Detailed Statistical Analysis of Target Numbers (Part 1)
Context:
This analysis is part of “Accumulative Age Analysis in Biblical Chronologies: From Adam to Joshua,” focusing on specific target numbers within a contiguous sequence for probability analysis.
Sequence Analyzed:
[20, 9300, 9120, 9050, 9100, 8950, 9620, 3650, 9690, 7770, 9500, 6000, 20, 4380, 4600, 4330, 4640, 2390, 2390, 2300, 1480, 2050, 1750, 1800, 1470, 1370, 1330, 1370, 1200, 30, 1100]
Total Number of Sums:
496
Minimum and Maximum Sums:
- Minimum: 20
- Maximum: 131770
Analysis for Each Target Number (which includes its multiples):
- Target Multiples of 4578
- Margin 65
- Observed Frequencies: 32
- Expected Frequency: 13.802
- Z-Score (σ): 4.968
- P-Value: ≈ 3.38e-07
- Margin 70
- Observed Frequencies: 38
- Expected Frequency: 14.855
- Z-Score (σ): 6.097
- P-Value: ≈ 5.40e-10
- Margin 75
- Observed Frequencies: 39
- Expected Frequency: 15.908
- Z-Score (σ): 5.885
- P-Value: ≈ 1.99e-09
- Target 4579
- Margin 65
- Observed Frequencies: 36
- Expected Frequency: 13.802
- Z-Score (σ): 6.060
- P-Value: ≈ 6.81e-10
- Margin 70
- Observed Frequencies: 38
- Expected Frequency: 14.855
- Z-Score (σ): 6.097
- P-Value: ≈ 5.40e-10
- Margin 75
- Observed Frequencies: 40
- Expected Frequency: 15.908
- Z-Score (σ): 6.140
- P-Value: ≈ 4.14e-10
- Target 4580
- Margin 65
- Observed Frequencies: 37
- Expected Frequency: 13.802
- Z-Score (σ): 6.333
- P-Value: ≈ 1.20e-10
- Margin 70
- Observed Frequencies: 43
- Expected Frequency: 14.855
- Z-Score (σ): 7.414
- P-Value: ≈ 6.12e-14
- Margin 75
- Observed Frequencies: 43
- Expected Frequency: 15.908
- Z-Score (σ): 6.904
- P-Value: ≈ 2.52e-12
Interpretation for Targets 4578 – 4580:
- Significant Deviations: The observed frequencies significantly exceed the expected frequencies across all margins.
- Statistical Significance: Extremely low p-values and high Z-scores indicate these results are highly unlikely to occur by chance.
- Implications: This pattern suggests a deliberate structure or design in the chronology, potentially carrying symbolic or historical significance.
General Considerations:
- The analysis reveals distinct patterns in the chronology, aligning with the study’s objective to detect numerical patterns.
- These findings could provide insights into the composition and interpretation of biblical chronologies.
The analysis for the remaining target numbers (4581-4585) will be provided in the next part of the response.
Detailed Statistical Analysis of Target Multiples (Part 2)
Continuing from the previous analysis, we investigate the results for the remaining target numbers within the specified sequence.
Analysis for Each Target Number (Continued):
- Target 4581
- Margin 65
- Observed Frequencies: 42
- Expected Frequency: 13.802
- Z-Score (σ): 7.698
- P-Value: ≈ 6.88e-15
- Margin 70
- Observed Frequencies: 43
- Expected Frequency: 14.855
- Z-Score (σ): 7.414
- P-Value: ≈ 6.12e-14
- Margin 75
- Observed Frequencies: 46
- Expected Frequency: 15.908
- Z-Score (σ): 7.669
- P-Value: ≈ 8.66e-15
- Target 4582
- Margin 65
- Observed Frequencies: 42
- Expected Frequency: 13.802
- Z-Score (σ): 7.698
- P-Value: ≈ 6.88e-15
- Margin 70
- Observed Frequencies: 44
- Expected Frequency: 14.855
- Z-Score (σ): 7.678
- P-Value: ≈ 8.10e-15
- Margin 75
- Observed Frequencies: 48
- Expected Frequency: 15.908
- Z-Score (σ): 8.178
- P-Value: ≈ 1.11e-16
- Target 4583
- Margin 65
- Observed Frequencies: 40
- Expected Frequency: 13.802
- Z-Score (σ): 7.152
- P-Value: ≈ 4.28e-13
- Margin 70
- Observed Frequencies: 41
- Expected Frequency: 14.855
- Z-Score (σ): 6.887
- P-Value: ≈ 2.84e-12
- Margin 75
- Observed Frequencies: 45
- Expected Frequency: 15.908
- Z-Score (σ): 7.414
- P-Value: ≈ 6.13e-14
- Target 4584
- Margin 65
- Observed Frequencies: 35
- Expected Frequency: 13.802
- Z-Score (σ): 5.787
- P-Value: ≈ 3.58e-09
- Margin 70
- Observed Frequencies: 39
- Expected Frequency: 14.855
- Z-Score (σ): 6.361
- P-Value: ≈ 1.01e-10
- Margin 75
- Observed Frequencies: 40
- Expected Frequency: 15.908
- Z-Score (σ): 6.140
- P-Value: ≈ 4.14e-10
- Target 4585
- Margin 65
- Observed Frequencies: 34
- Expected Frequency: 13.802
- Z-Score (σ): 5.514
- P-Value: ≈ 1.75e-08
- Margin 70
- Observed Frequencies: 38
- Expected Frequency: 14.855
- Z-Score (σ): 6.097
- P-Value: ≈ 5.40e-10
- Margin 75
- Observed Frequencies: 38
- Expected Frequency: 15.908
- Z-Score (σ): 5.630
- P-Value: ≈ 9.01e-09
Interpretation for Targets 4581 – 4585:
- Strong Statistical Significance: High Z-scores and extremely low p-values across these targets suggest significant deviations from expected frequencies.
- Consistent Patterns: The pattern of observed frequencies exceeding expected frequencies is consistent across all targets, particularly at higher margins.
- Potential Implications: These results might indicate a non-random occurrence of these specific multiples within the sequence, possibly suggesting an intentional pattern or a symbolic element in the chronology
.
General Observations:
- The analysis across all targets reveals a notable trend of significant statistical deviations, which may bear implications for understanding the composition of biblical chronologies.
- The findings align with the study’s objective to explore numerical patterns in chronology and provide insights into potential structuring within the biblical text.
Conclusion:
The detailed statistical analysis of each target number within the “Accumulative Age Analysis” reveals significant deviations from expected frequencies across all targets, especially at higher margins. This suggests potential patterns or deliberate structuring in the biblical chronology from Adam to Joshua, offering a new perspective in the study of biblical numerology and chronology.
Final Summation
Numerical Symmetry in Chronology: Bridging Solar and Enochian Years with “460”
The observed prevalence of 458.2 as a multiple significantly exceeds what random chance would predict, pointing to a deliberate pattern. This mirrors the extraordinary frequency of multiples of 46 in conventional chronologies, suggesting a purposeful use of these numerical values. The analysis posits that these figures, especially 46, hold critical significance in Biblical Chronology. In the broader context of the Accumulative Chronology, this significance is magnified tenfold, aligning with 460, a conclusion that aligns with earlier findings.
This slight deviation between 458.2 and 460 can be primarily reconciled by considering the Accumulative Chronology’s dual use of both the standard solar year and the Enochian year, which is 364 days long. In the following section, we further explore the notion that this distinct 364-day year framework was deliberately incorporated into the chronology, acting in a secondary role to the conventional solar year.
The table presented below is directly derived from the previous chart, converted to reflect an unadjusted Enochian year consisting of 364 days.
Concluding Analysis:
The Significance of Adjusting Patriarchal Ages to the Enochian Calendar
Supplementary Revised Dates from Adam to Joshua for a 364-Day Year, Secondary to the Main Chart with Standard Solar Years
Dates with a 3+2 margin are converted by 365.2422/364 = 1.00341 to reflect the possibility that the patriarchs’ ages may ALSO convert to the Enochian 364-day year, as evidenced by the 458.2 exceptional frequency-multiple.
For example, Adam lived “930 years”: (“930″x365.2422/364=933.2, etc.)
Enochic Dates of Adam to Joshua
- ( 14054.0 BC – 933.2 = 13120.8 BC ) Adam
(Max: Apr., 14056.0 BC if with+2yr. 14517.6 w. 2Cainan) - ( 13120.8 – 915.1 = 12205.7 ) Seth
- ( 12205.7 – 908.1 = 11297.6 ) Enosh
- ( 11297.6 – 913.1 = 10384.5 ) Kenan
- ( 10384.5 – 898.0 = 9486.5 ) Mahalaleel
- ( 9486.5 – 965.3 = 8521.2 ) Jarod
- ( 8521.2 – 366.2 = 8155.0 ) Enoch (or, *365.2, or *365)
- ( 8155.0 – 972.3 = 7182.7 ) Methusaleh
- ( 7182.7 – 779.6 = 6403.1 ) Lamech
- ( 6403.1 – 953.2 = 5449.9 ) Noah
- ( 5449.9 – 604.0 = 4845.9 ) (Flood. Inc. +2 of Shem, thus, 4843.9/4845.9)
(Or with 2Cainan 461.6 = 4868.0 – 4406.4 BC, Flood 5307.5, etc. back to Adam. **2Cainan preferentially remains 460 as per footnote.) - ( 4845.9 – 439.5 = 4406.4 ) Arphaxad
- ( 4406.4 – 434.5 = 3971.9 ) Shelah
- ( 3971.9 – 465.6 = 3506.3 ) Eber
- ( 3506.3 – 239.8 = 3266.5 ) Peleg
- ( 3266.5 – 239.8 = 3026.7 ) Reu
- ( 3026.7 – 230.8 = 2795.9 ) Serug
- ( 2795.9 – 148.5 = 2647.4 ) Nahor
- ( 2647.4 – 205.7 = 2441.7 ) Terah
- ( 2441.7 – 175.6 = 2266.1 ) Abraham
- ( 2266.1 – 180.6 = 2085.5 ) Issac
- ( 2085.5 – 147.5 = 1938.0 ) Jacob
- ( 1938.0 – 137.5 = 1800.5 ) Levi
- ( 1800.5 – 133.5 = 1667.0 ) Kohath
- ( 1667.0 – 137.5 = 1529.5 ) Amram
- ( 1529.5 – ***123.4 = 1406.0 BC ) (Incl. +3 Aaron; 3.5 possible =***124) Moses
- ( 1406.0 – 110.4 = 1295.6 BC) = 1296 BC, Aug.; same for all) Joshua
* The 1-yr anomaly of Enoch’s 365 years: Enoch lived “365 years,” yet we know an Enochian year is 364 days. This leaves us with the option of viewing “365 yrs” as solar, Egyptian 365, or 364 days. Simply put, 365 yrs of 364 days is 364 solar yrs, reducing Creation from (12600+43) to (12599+43 = 293&294x43), distributing the 364 days—a week at the end & start of the deaths & births with 7&7dys (26 gen. of 490 yrs on average). Each generation repeats the ‘woman from man, man from woman’ motif beginning at Adam, with his “deep sleep” (death) and rebirth/resurrection, culminating at Christ, Gen. 2:21-23; Lev. 12:1-8; Luke 2:21-39; 1Cor. 11:8-12, with optional 2Cainan the circumcision on the 365th dy (=8th dy)—as Enoch is “7th from Adam” making Methuselah the 8th, who was cut-off/circumcised metaphorically at the Flood; Col. 2:11-13; 1Pet. 3:18-22.
** The +1.6-yr of 2Cainan’s 460 years: The ‘460’ of NT/LXX 2Cainan, likely unique, stays ‘460’ in a 364-day year context; otherwise, it becomes 461.57. See The Numerical Tapestry of Redemption: Unveiling the 7 & 130 Connection, where 2Cainan’s 460 appears to fit 458 and 460 when reinserted within the regular chronology: This analysis reveals a combined duration of “910”+458+”460″ years between the births and deaths of the two Cainans, leading to 2Cainan’s death at the time of Abraham’s departure from Ur of the Caladees. Hence, Creation to the 458 years separating the two Cainans is 11500 years (5x5x460), spanning 14509 – 3009 BC (1Cainan’s death) and 14051 – 2551 BC (2Cainan’s birth), Dan. 8. (Incl. “130 years” of 2Cainan in the standard chronology.) Moreover, the difference between Cainains in the Accumulative Chronogy is 13&14×460, and to regular Cainans, 9200±460 (9200=20×460).
*** The +.4-yr of Moses’ 120 years: Moses’ lifespan seems deliberately reduced by the symbolic “150 days” (5 months) of the Flood, Gen. 8:3. His life totals 120×364 days, beginning with his Nile rescue and naming by Pharaoh’s daughter, based on a New Year birth in 1526 BC, and death six months post-Aaron, Ex. 2:2, Num. 33:38, Ex. 34; Luke 1:36.
The net effect of Enoch, 2Cainan, and Moses is precisely minus three years (1+1.6+.4=3). Without 2Cainan, Max. & Min. Creation is 12610/12600 to Exodus in 1446 BC.
Note: Aaron’s 123 converts to 123.4, but the rounding effect from Adam to Aaron/Moses results in a loss of about .1 year. This slight shortfall is added here, considering Moses’ death is also about .1 year before the Conquest and Aaron’s .6 year.
Interesting Timeline: Cainan to Christ is 4900
Various significant biblical time spans emerge from the previously mentioned date table, extending beyond the focus of this article. As an illustrative example, consider 2Cainan’s birth, which precisely aligns 4900.0 years before AD 33, the year of Christ’s death. But if we use the ‘460’ option for 2Cainan, less the 3.4 difference at the Conquest, the result is precisely 4830.0 years to 33 BC, the mirror of AD 33, thereby making the “dividing” of the 70 at 1BC/AD1, when Christ came into the world according to the world’s calendar, (Dan. 9:24-27). (Ex. 2:2, Num. 33:38, Ex. 34: Moses’ life = 120×364 days, starting with his rescue by Pharaoh’s daughter and naming, assuming New Year birth in 1526 BC.)
The table below displays occurrences of 460 multiples in the specified sequence, with margins between 1 and 10. Initially, the analysis includes 2Cainan; later, it’s done without 2Cainan. The table also shows where these occurrences fall within margins of 1 to 8. Notably, using 460 of Cainan, plus or minus 6 and 7 margins have the highest Sigma score. This aligns with previous findings where 458.2 also had a high score in the original sequence before converting to a 364-day year format, as in this case.
The maximum-to-minimum span from Adam to 1406 BC is exactly 12650 years, 46 x 55, which does not show up in the below analysis because we only targeted multiples of 460, not 230. Thus, 115 (5×23) x 110 years span Adam to 1406 BC, with another 110 if Joshua is included.
Multiples of 460 with an 8-year Margin (displayed as “80” in the table below).
Cainan’s solar 460 is 461.6 years of 364 days. Note that the margins of 60 and 70 (= 6 and 7) have the highest sigma values.
The analysis of the updated sequence concerning target multiples of 4600, using margins ranging from +/-10 to 100 (really 1-10), has been completed. The details for each margin are summarized in the following table:
| Margin x-10 | Observed Frequency | Expected Frequency | Sigma (Z-score) | p-value | 1 in … Format |
|---|---|---|---|---|---|
| 10 | 6 | 1.71 | 3.28 | 0.00051 | 1961 |
| 20 | 9 | 3.34 | 3.11 | 0.00094 | 1064 |
| 30 | 13 | 4.97 | 3.62 | 0.00015 | 6893 |
| 40 | 18 | 6.60 | 4.47 | ~0.00000382 | 261448 |
| 50 | 23 | 8.23 | 5.20 | ~0.000000098 | 10227640 |
| 60 | 27 | 9.86 | 5.53 | ~0.000000016 | 62159490 |
| 70 | 30 | 11.49 | 5.54 | ~0.000000015 | 67543510 |
| 80 | 32 | 13.12 | 5.30 | ~0.000000057 | 17598370 |
| 90 | 34 | 14.75 | 5.11 | ~0.000000160 | 6249206 |
| 100 | 39 | 16.38 | 5.71 | ~0.000000006 | 179492700 |
This table provides a comprehensive overview of how changing the margin affects target multiples’ observed and expected frequencies and the statistical significance of the findings, as indicated by the Sigma (Z-score) and p-value.
Sequences that contain multiples of 460 (2Cainan included)
Here are the 32 instances within the sequence where the sum of a contiguous subsequence falls within a margin of 8 of a multiple of 460 (and therefore margins 1-8 also). However, recall that margins 6 and 7 yield the highest Sigma value. You can compare the sequence starting position, such as “933.2” with the chart of dates using the 364-day year. Thus, “933.2” refers to the birth of Adam, and the ending point of “908.1” refers to the birth of Enosh. (930×365.2422/364=933.2, etc.)
- Subsequence: [933.2, 915.1, 908.1], Sum: 2756.4, Target Multiple: 2760
- Subsequence: [933.2, 915.1, 908.1, 913.1, 898.0, 965.3, 366.2, 972.3, 779.6, 953.2, 602.0], Sum: 9206.1, Target Multiple: 9200
- Subsequence: [915.1], Sum: 915.1, Target Multiple: 920
- Subsequence: [915.1, 908.1, 913.1, 898.0, 965.3], Sum: 4599.6, Target Multiple: 4600
- Subsequence: [915.1, 908.1, 913.1, 898.0, 965.3, 366.2, 972.3, 779.6, 953.2, 602.0], Sum: 8272.9, Target Multiple: 8280
- Subsequence: [915.1, 908.1, 913.1, 898.0, 965.3, 366.2, 972.3, 779.6, 953.2, 602.0, 439.5, 461.6, 434.5, 465.6, 239.8, 239.8, 230.8, 148.5, 205.7, 175.6, 180.6], Sum: 11494.9, Target Multiple: 11500
- Subsequence: [908.1, 913.1, 898.0, 965.3], Sum: 3684.5, Target Multiple: 3680
- Subsequence: [908.1, 913.1, 898.0, 965.3, 366.2, 972.3, 779.6, 953.2, 602.0], Sum: 7357.8, Target Multiple: 7360
- Subsequence: [908.1, 913.1, 898.0, 965.3, 366.2, 972.3, 779.6, 953.2, 602.0, 439.5, 461.6, 434.5, 465.6, 239.8, 239.8, 230.8, 148.5, 205.7, 175.6, 180.6], Sum: 10579.8, Target Multiple: 10580
- Subsequence: [913.1], Sum: 913.1, Target Multiple: 920
- Subsequence: [898.0, 965.3, 366.2, 972.3, 779.6, 953.2, 602.0, 439.5], Sum: 5976.1, Target Multiple: 5980
- Subsequence: [898.0, 965.3, 366.2, 972.3, 779.6, 953.2, 602.0, 439.5, 461.6], Sum: 6437.7, Target Multiple: 6440
- Subsequence: [898.0, 965.3, 366.2, 972.3, 779.6, 953.2, 602.0, 439.5, 461.6, 434.5, 465.6, 239.8, 239.8], Sum: 7817.4, Target Multiple: 7820
- Subsequence: [965.3, 366.2, 972.3], Sum: 2303.8, Target Multiple: 2300
- Subsequence: [965.3, 366.2, 972.3, 779.6, 953.2, 602.0, 439.5, 461.6, 434.5], Sum: 5974.2, Target Multiple: 5980
- Subsequence: [965.3, 366.2, 972.3, 779.6, 953.2, 602.0, 439.5, 461.6, 434.5, 465.6], Sum: 6439.8, Target Multiple: 6440
- Subsequence: [965.3, 366.2, 972.3, 779.6, 953.2, 602.0, 439.5, 461.6, 434.5, 465.6, 239.8, 239.8, 230.8, 148.5, 205.7, 175.6, 180.6, 147.5, 137.5, 133.5], Sum: 8279.1, Target Multiple: 8280
- Subsequence: [366.2, 972.3, 779.6, 953.2, 602.0], Sum: 3673.3, Target Multiple: 3680
- Subsequence: [366.2, 972.3, 779.6, 953.2, 602.0, 439.5, 461.6, 434.5, 465.6, 239.8, 239.8, 230.8, 148.5, 205.7, 175.6, 180.6], Sum: 6895.3, Target Multiple: 6900
- Subsequence: [779.6, 953.2, 602.0, 439.5, 461.6, 434.5, 465.6], Sum: 4136.0, Target Multiple: 4140
- Subsequence: [779.6, 953.2, 602.0, 439.5, 461.6, 434.5, 465.6, 239.8, 239.8, 230.8, 148.5, 205.7, 175.6, 180.6, 147.5, 137.5, 133.5], Sum: 5975.3, Target Multiple: 598
- Subsequence: [953.2, 602.0, 439.5, 461.6, 434.5, 465.6, 239.8, 239.8, 230.8, 148.5, 205.7, 175.6], Sum: 4596.6, Target Multiple: 4600
- Subsequence: [953.2, 602.0, 439.5, 461.6, 434.5, 465.6, 239.8, 239.8, 230.8, 148.5, 205.7, 175.6, 180.6, 147.5, 137.5], Sum: 5062.2, Target Multiple: 50
- Subsequence: [439.5, 461.6, 434.5, 465.6, 239.8, 239.8, 230.8, 148.5, 205.7, 175.6, 180.6], Sum: 3222.0, Target Multiple: 3220
- Subsequence: [461.6], Sum: 461.6, Target Multiple: 460
- Subsequence: [461.6, 434.5, 465.6, 239.8, 239.8], Sum: 1841.3, Target Multiple: 1840
- Subsequence: [434.5, 465.6, 239.8, 239.8], Sum: 1379.7, Target Multiple: 1380
- Subsequence: [465.6], Sum: 465.6, Target Multiple: 460
- Subsequence: [465.6, 239.8, 239.8, 230.8, 148.5, 205.7, 175.6, 180.6, 147.5, 137.5, 133.5], Sum: 2304.9, Target Multiple: 2300
- Subsequence: [239.8, 239.8, 230.8, 148.5, 205.7, 175.6, 180.6, 147.5, 137.5, 133.5], Sum: 1839.3, Target Multiple: 1840
- Subsequence: [175.6, 180.6, 147.5, 137.5, 133.5, 137.5], Sum: 912.2, Target Multiple: 920
- Subsequence: [180.6, 147.5, 137.5], Sum: 465.6, Target Multiple 460
2Cainan Excluded
The analysis of the given sequence concerning target multiples of 4600 (that is, ten times the actual number for accurate computing), using margins ranging from 10 to 100, has been completed. The details for each margin are summarized in the following table:
| Margin x-10 | Observed Frequency | Expected Frequency | Sigma (Z-score) | p-value | 1 in … Format |
|---|---|---|---|---|---|
| 10 | 5 | 1.59 | 2.71 | 0.00335 | 298.75 |
| 20 | 7 | 3.10 | 2.22 | 0.01313 | 76.15 |
| 30 | 9 | 4.62 | 2.05 | 0.02000 | 50.00 |
| 40 | 12 | 6.13 | 2.39 | 0.00838 | 119.30 |
| 50 | 17 | 7.64 | 3.42 | 0.00031 | 3213.75 |
| 60 | 20 | 9.16 | 3.63 | 0.00014 | 7078.40 |
| 70 | 27 | 10.67 | 5.08 ) | ~0.000000192 | 5,204,684 |
| 80 | 30 | 12.18 | 5.19 | ~0.000000102 | 9,761,224 |
| 90 | 31 | 13.70 | 4.77 | ~0.000000926 | 1,079,502 |
| 100 | 33 | 15.21 | 4.66 | ~0.000001558 | 642,049.9 |
Enochian Year’s Target 460 with an 8-year Margin (Displayed as 80″ in the Above Table.)
2Cainan is excluded.
Multiples of 460 within 8-Day Margin, Consequently Including 1-8.
- Subsequence: [933.2, 915.1, 908.1], Sum: 2756.4, Target Multiple: 2760
- Subsequence: [933.2, 915.1, 908.1, 913.1, 898.0, 965.3, 366.2, 972.3, 779.6, 953.2, 602.0], Sum: 9206.1, Target Multiple: 9200
- Subsequence: [933.2, 915.1, 908.1, 913.1, 898.0, 965.3, 366.2, 972.3, 779.6, 953.2, 602.0, 439.5, 434.5, 465.6, 239.8, 239.8, 230.8, 148.5, 205.7, 175.6, 180.6], Sum: 11966.5, Target Multiple: 11960
- Subsequence: [915.1], Sum: 915.1, Target Multiple: 920
- Subsequence: [915.1, 908.1, 913.1, 898.0, 965.3], Sum: 4599.6, Target Multiple: 4600
- Subsequence: [915.1, 908.1, 913.1, 898.0, 965.3, 366.2, 972.3, 779.6, 953.2, 602.0], Sum: 8272.9, Target Multiple: 8280
- Subsequence: [915.1, 908.1, 913.1, 898.0, 965.3, 366.2, 972.3, 779.6, 953.2, 602.0, 439.5, 434.5, 465.6, 239.8, 239.8, 230.8, 148.5, 205.7, 175.6, 180.6], Sum: 11033.3, Target Multiple: 11040
- Subsequence: [908.1, 913.1, 898.0, 965.3], Sum: 3684.5, Target Multiple: 3680
- Subsequence: [908.1, 913.1, 898.0, 965.3, 366.2, 972.3, 779.6, 953.2, 602.0], Sum: 7357.8, Target Multiple: 7360
- Subsequence: [908.1, 913.1, 898.0, 965.3, 366.2, 972.3, 779.6, 953.2, 602.0, 439.5, 434.5, 465.6, 239.8, 239.8, 230.8, 148.5, 205.7, 175.6, 180.6], Sum: 10118.2, Target Multiple: 10120
- Subsequence: [913.1], Sum: 913.1, Target Multiple: 920
- Subsequence: [898.0, 965.3, 366.2, 972.3, 779.6, 953.2, 602.0, 439.5], Sum: 5976.1, Target Multiple: 5980
- Subsequence: [898.0, 965.3, 366.2, 972.3, 779.6, 953.2, 602.0, 439.5, 434.5, 465.6, 239.8, 239.8], Sum: 7355.8, Target Multiple: 7360
- Subsequence: [965.3, 366.2, 972.3], Sum: 2303.8, Target Multiple: 2300
- Subsequence: [965.3, 366.2, 972.3, 779.6, 953.2, 602.0, 439.5, 434.5], Sum: 5563.1, Target Multiple: 5560
- Subsequence: [965.3, 366.2, 972.3, 779.6, 953.2, 602.0, 439.5, 434.5, 465.6], Sum: 5976.1, Target Multiple: 5980
- Subsequence: [965.3, 366.2, 972.3, 779.6, 953.2, 602.0, 439.5, 434.5, 465.6, 239.8, 239.8, 230.8, 148.5, 205.7, 175.6, 180.6, 147.5, 137.5, 133.5], Sum: 7817.5, Target Multiple: 7820
- Subsequence: [366.2, 972.3, 779.6, 953.2, 602.0], Sum: 3673.3, Target Multiple: 3680
- Subsequence: [366.2, 972.3, 779.6, 953.2, 602.0, 439.5, 434.5, 465.6, 239.8, 239.8, 230.8, 148.5, 205.7, 175.6, 180.6], Sum: 6433.7, Target Multiple: 6440
- Subsequence: [779.6, 953.2, 602.0, 439.5, 434.5, 465.6], Sum: 3674.4, Target Multiple: 3680
- Subsequence: [779.6, 953.2, 602.0, 439.5, 434.5, 465.6, 239.8, 239.8, 230.8, 148.5, 205.7, 175.6, 180.6, 147.5, 137.5, 133.5], Sum: 5513.7, Target Multiple: 5520
- Subsequence: [953.2, 602.0, 439.5, 434.5, 465.6, 239.8, 239.8, 230.8, 148.5, 205.7, 175.6], Sum: 4135.0, Target Multiple: 4140
- Subsequence: [953.2, 602.0, 439.5, 434.5, 465.6, 239.8, 239.8, 230.8, 148.5, 205.7, 175.6, 180.6, 147.5, 137.5], Sum: 4600.6, Target Multiple: 4600
- Subsequence: [439.5, 434.5, 465.6, 239.8, 239.8, 230.8, 148.5, 205.7, 175.6, 180.6], Sum: 2760.4, Target Multiple: 2760
- Subsequence: [434.5, 465.6, 239.8, 239.8], Sum: 1379.7, Target Multiple: 1380
- Subsequence: [465.6], Sum: 465.6, Target Multiple: 460
- Subsequence: [465.6, 239.8, 239.8, 230.8, 148.5, 205.7, 175.6, 180.6, 147.5, 137.5, 133.5], Sum: 2304.9, Target Multiple: 2300
- Subsequence: [239.8, 239.8, 230.8, 148.5, 205.7, 175.6, 180.6, 147.5, 137.5, 133.5], Sum: 1839.3, Target Multiple: 1840
- Subsequence: [175.6, 180.6, 147.5, 137.5, 133.5, 137.5], Sum: 912.2, Target Multiple: 920
- Subsequence: [180.6, 147.5, 137.5], Sum: 465.6, Target Multiple: 460
Also, see Probability Analysis of Target Multiple 46 for Births of Adam to Moses with its Subtle Variations: MT Regular Chronology (“430 years in Egypt”)
Part 1: Statistical Analysis of All Dates Given in MT from Terah to Joshua
Part 2: Statistical Analysis of Key Events in the Jacob-Levi Era in MT, LXX, SP, and Cumulative