DOW JONES CLOSES DOWN 2,352.6 POINTS, OR 9.99% (Reuters)
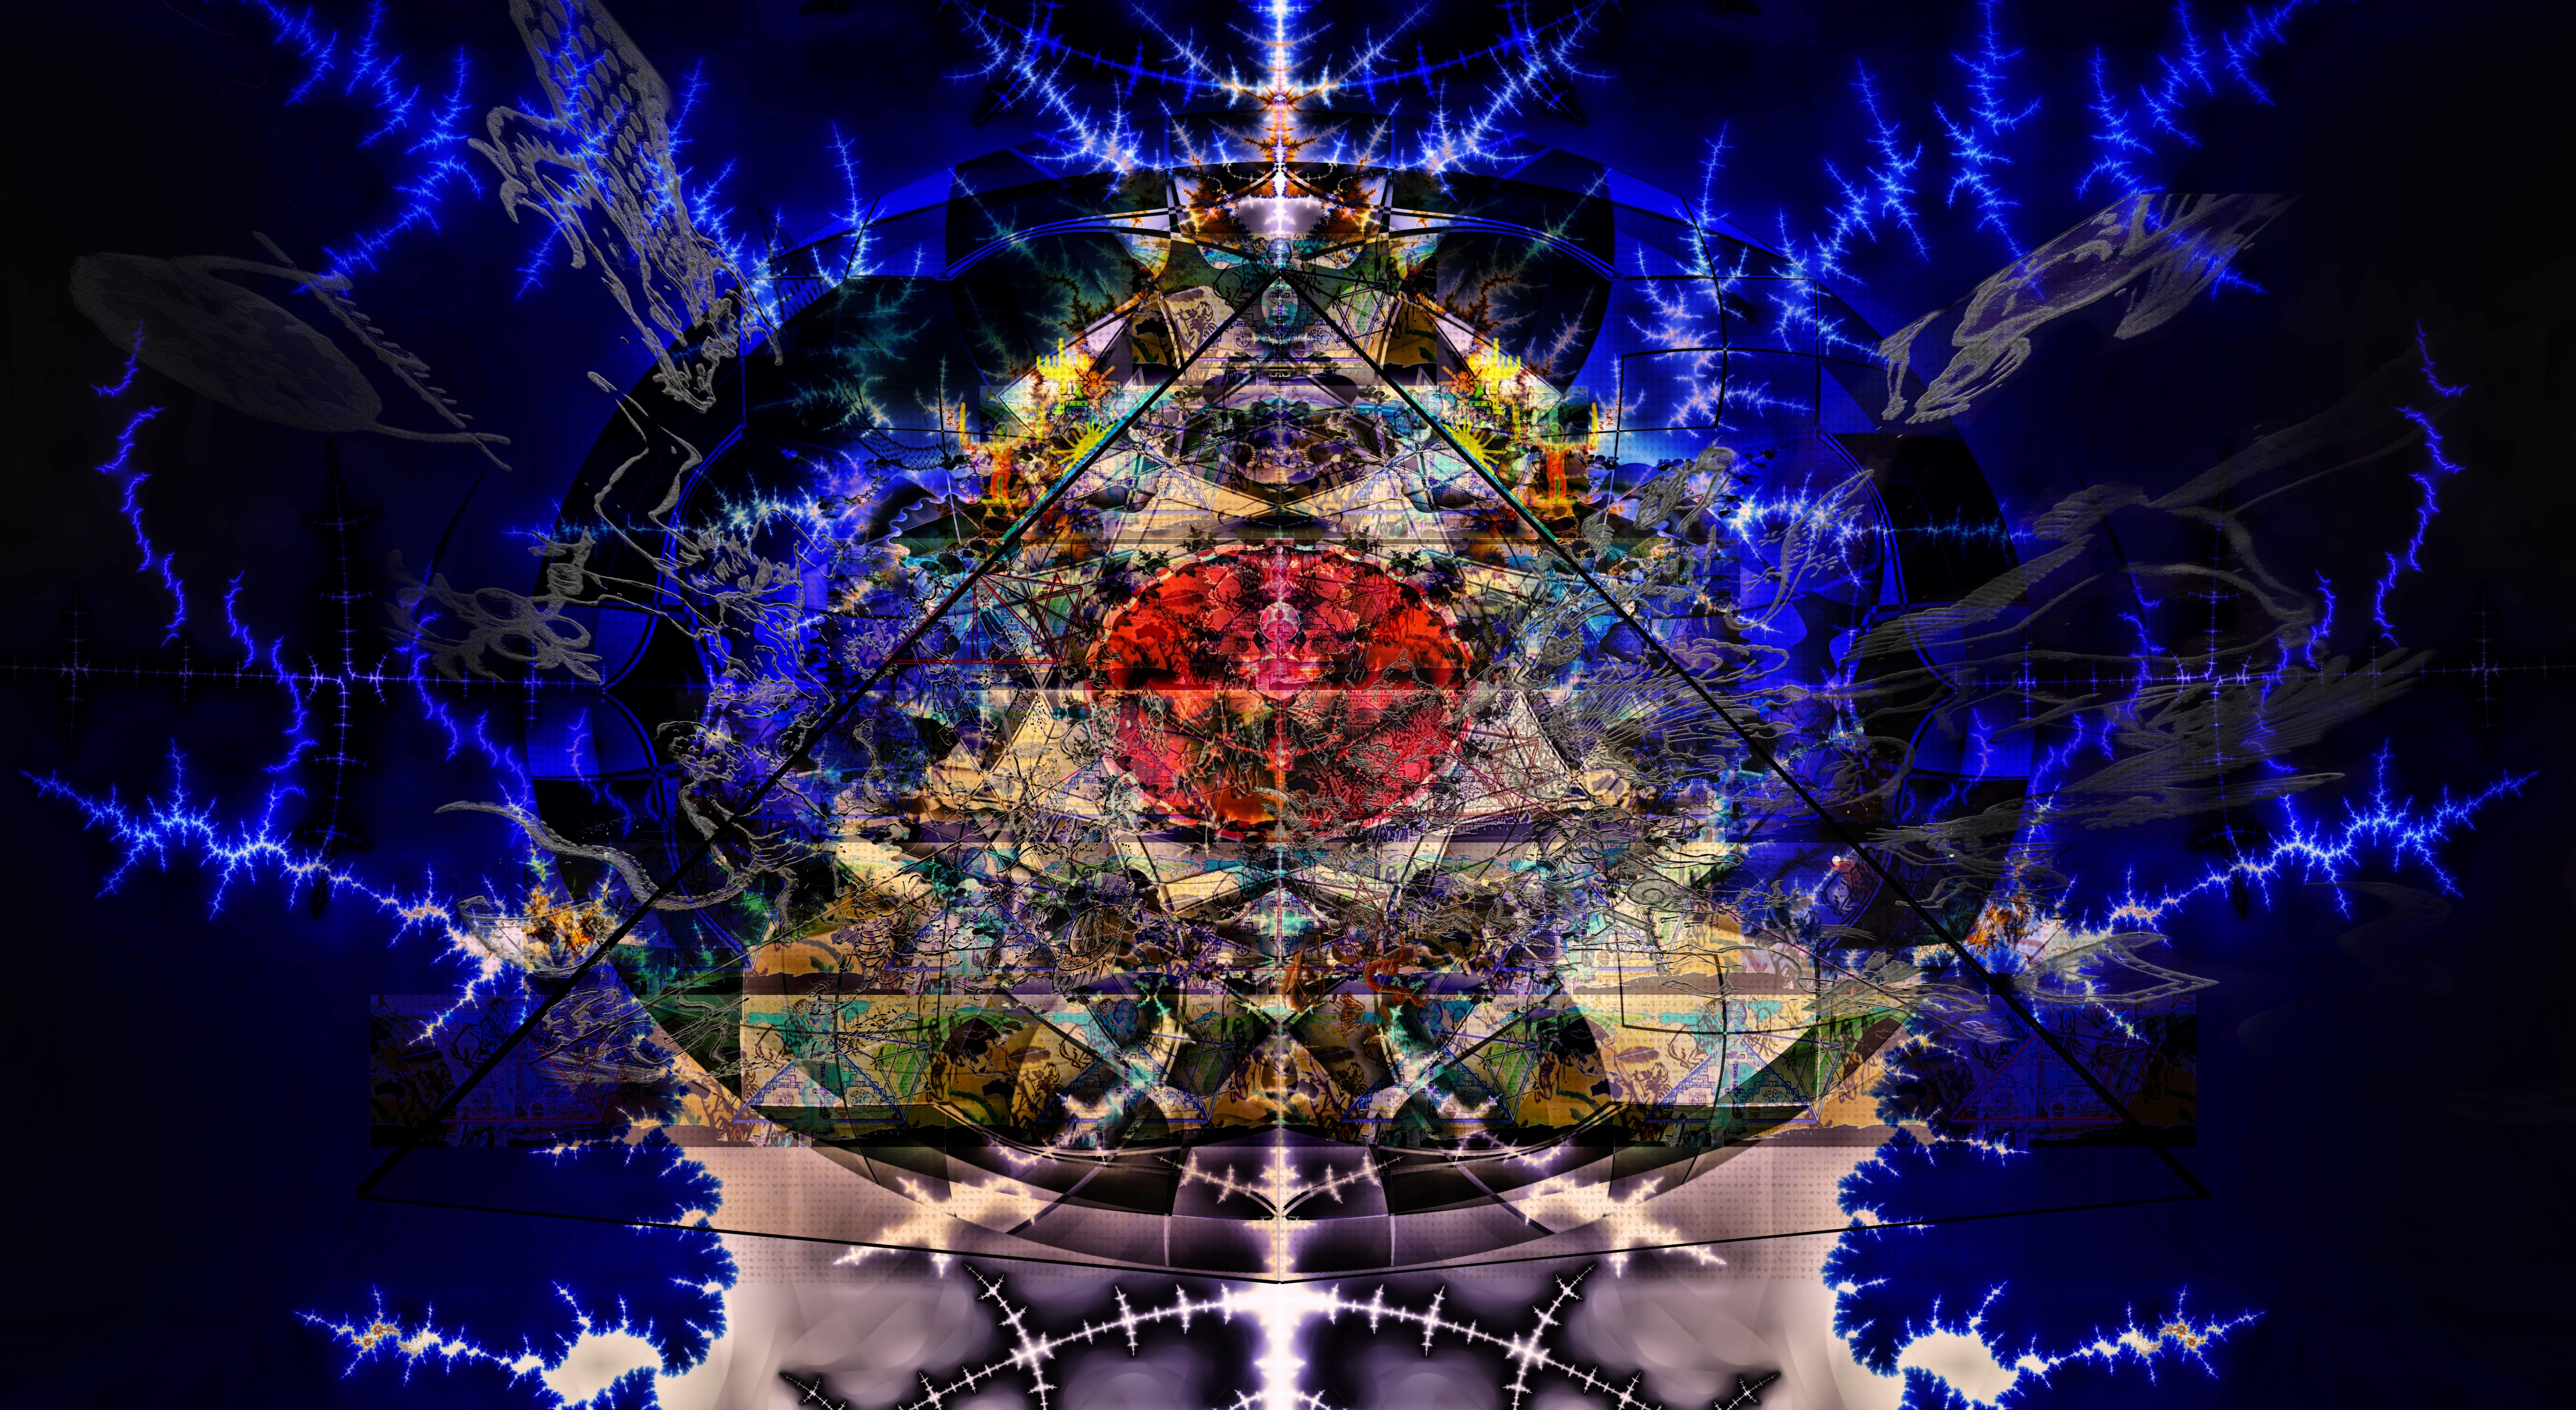
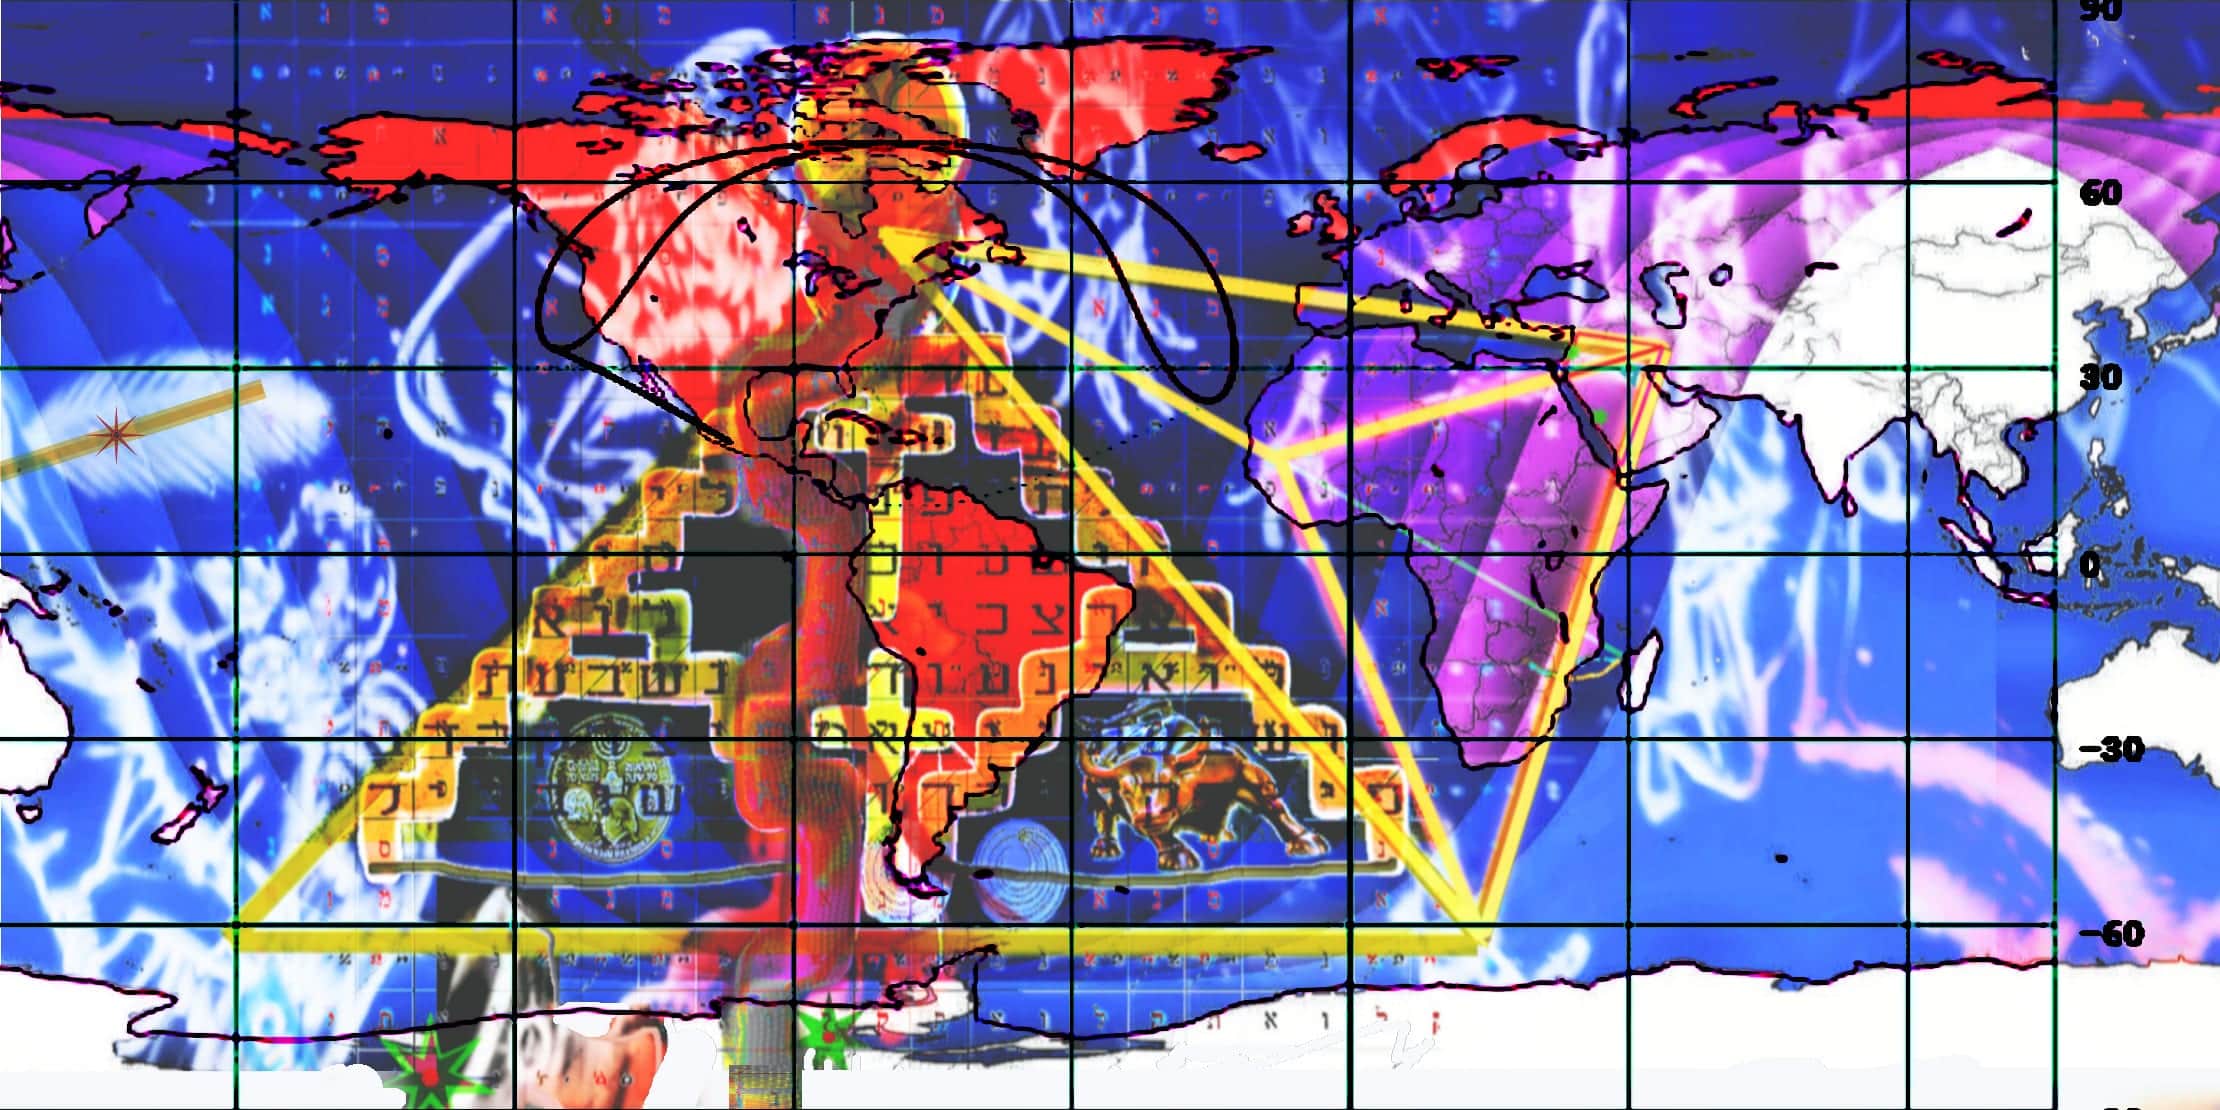
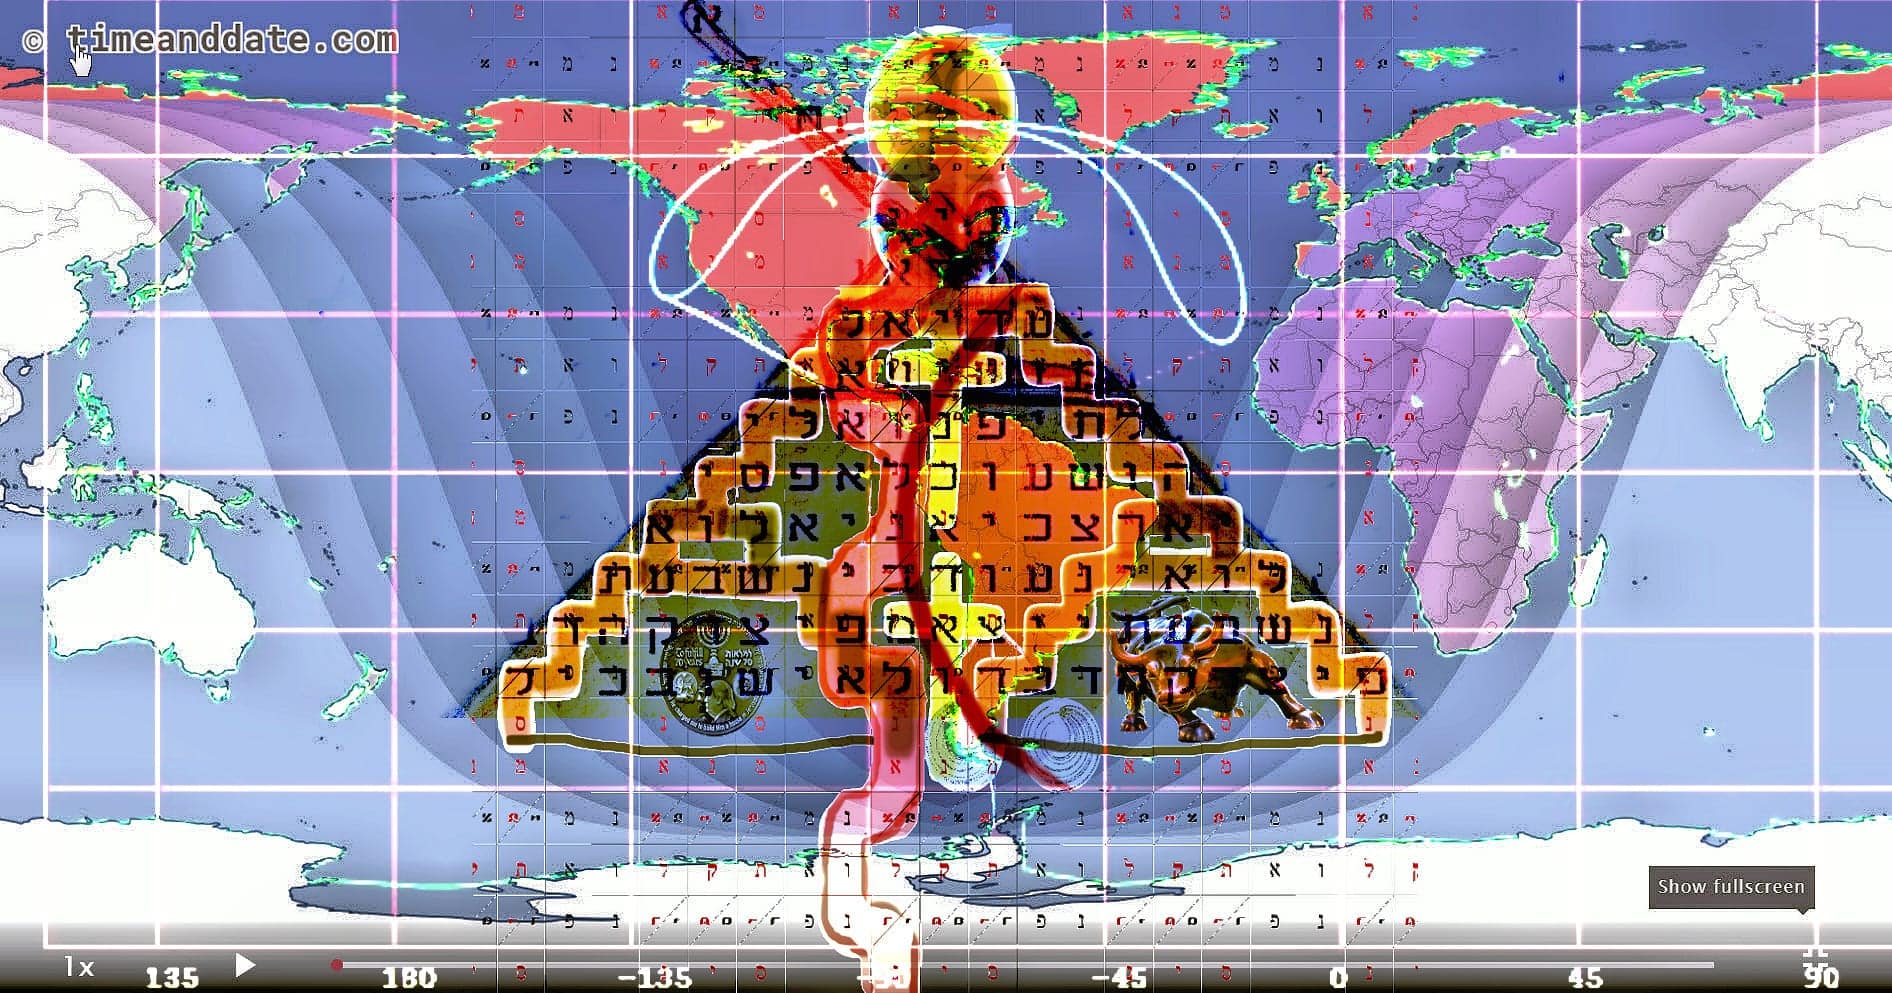
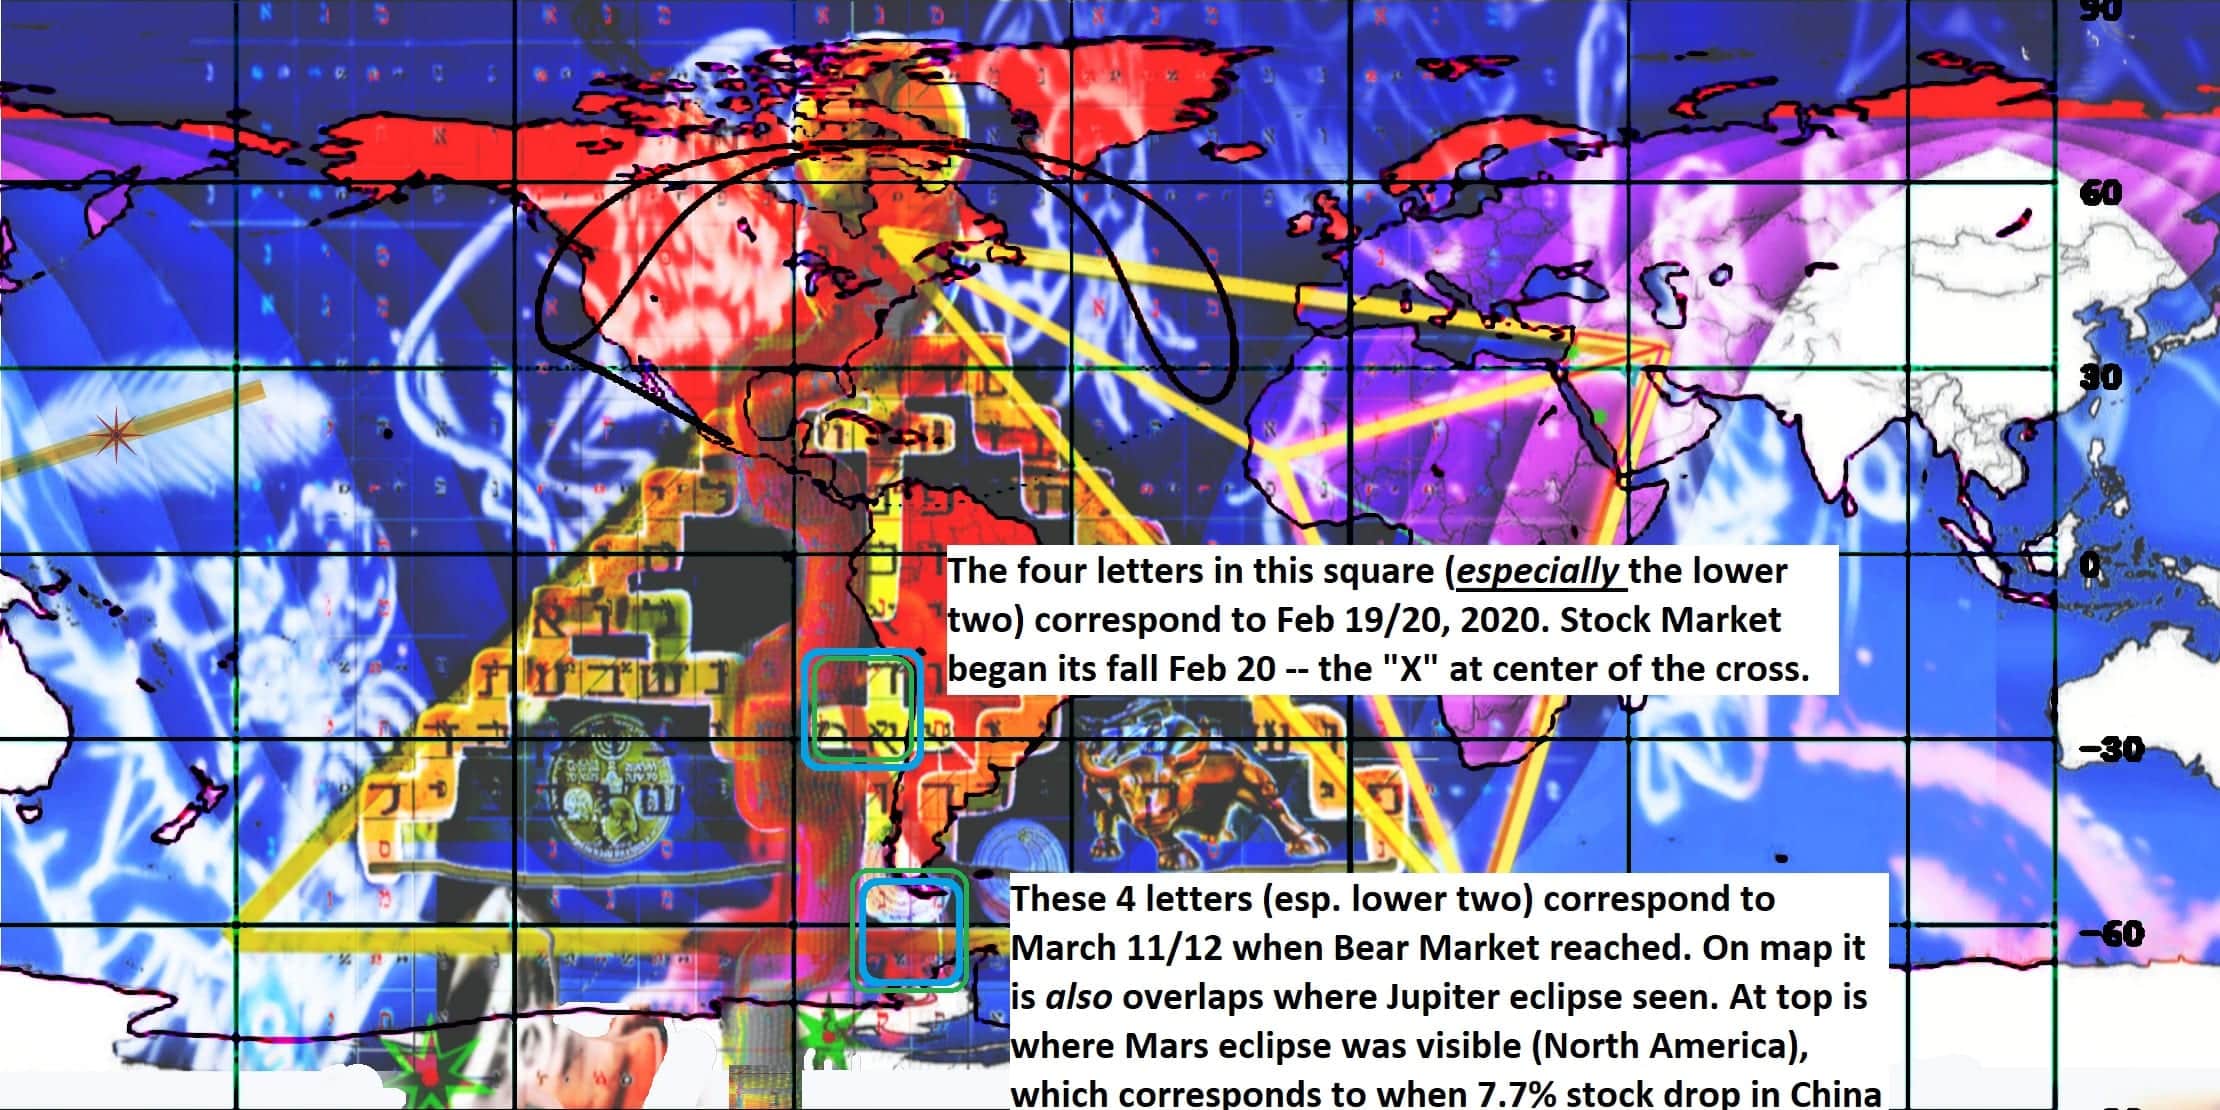
Yesterday, as the Stock Market was about to close, I pondered the location of the date (March 11, 12, 2020) on the “prophetic map” — the day that the Bear Market officially began. I observed that the date corresponds to the entrance to the inner sanctuary at the east gate in the fractal image. This is where the angel that looks like a bull is located — who guards the entrance. (Cherubim guarded the east entrance to Eden, Gen 3:24.)
(I already explained in past posts how that every day is counting down in the prophetic image, from top to bottom.)
Update: According to the Financial Post, the Bull Market ended Feb. 19th, 2020, which is Shebat 24th on the Jewish calendar. This is the day predicted by the Prophetic Picture. “Shebat 24th” was discussed at length in posts just days before Shebat 24th. It was the fastest decline ever into a bear market — twice as fast as 1929.
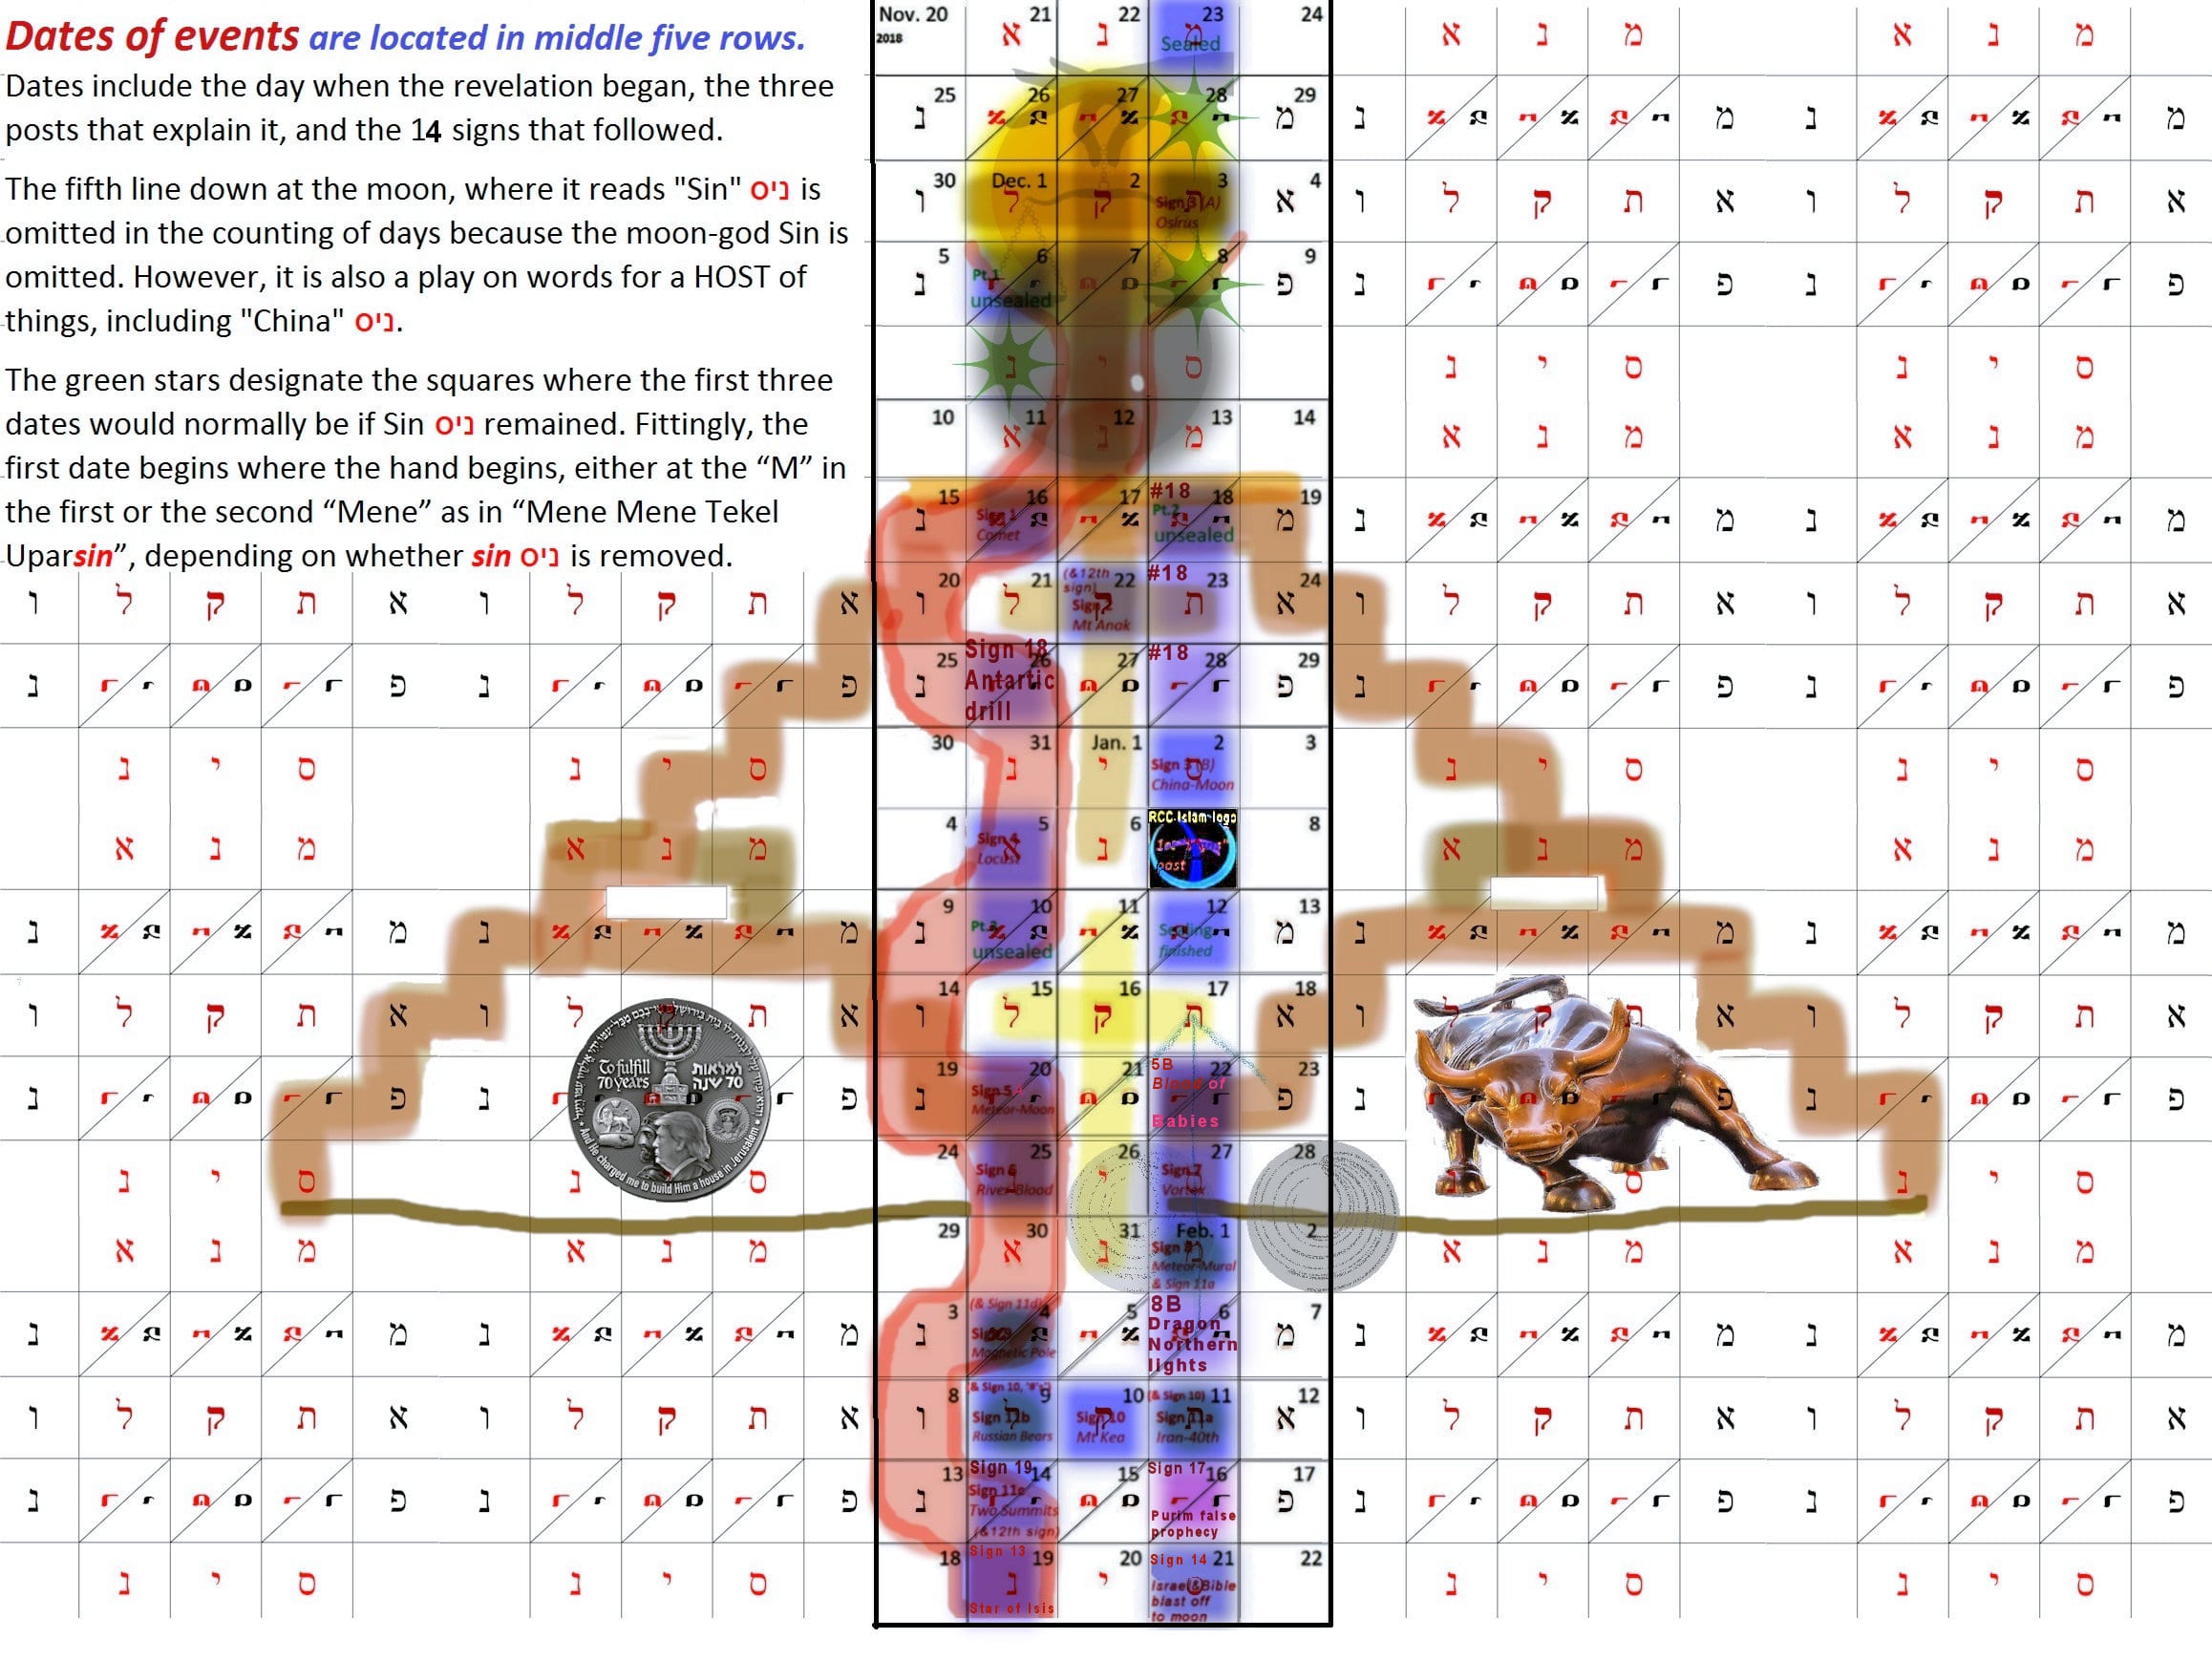
I thought to myself: “This will be hard to explain in a post. I will have to flip the bull (angel) upside down because at the East gate it already appears upside down (because it is located at the bottom of a circle of 14 angels).”
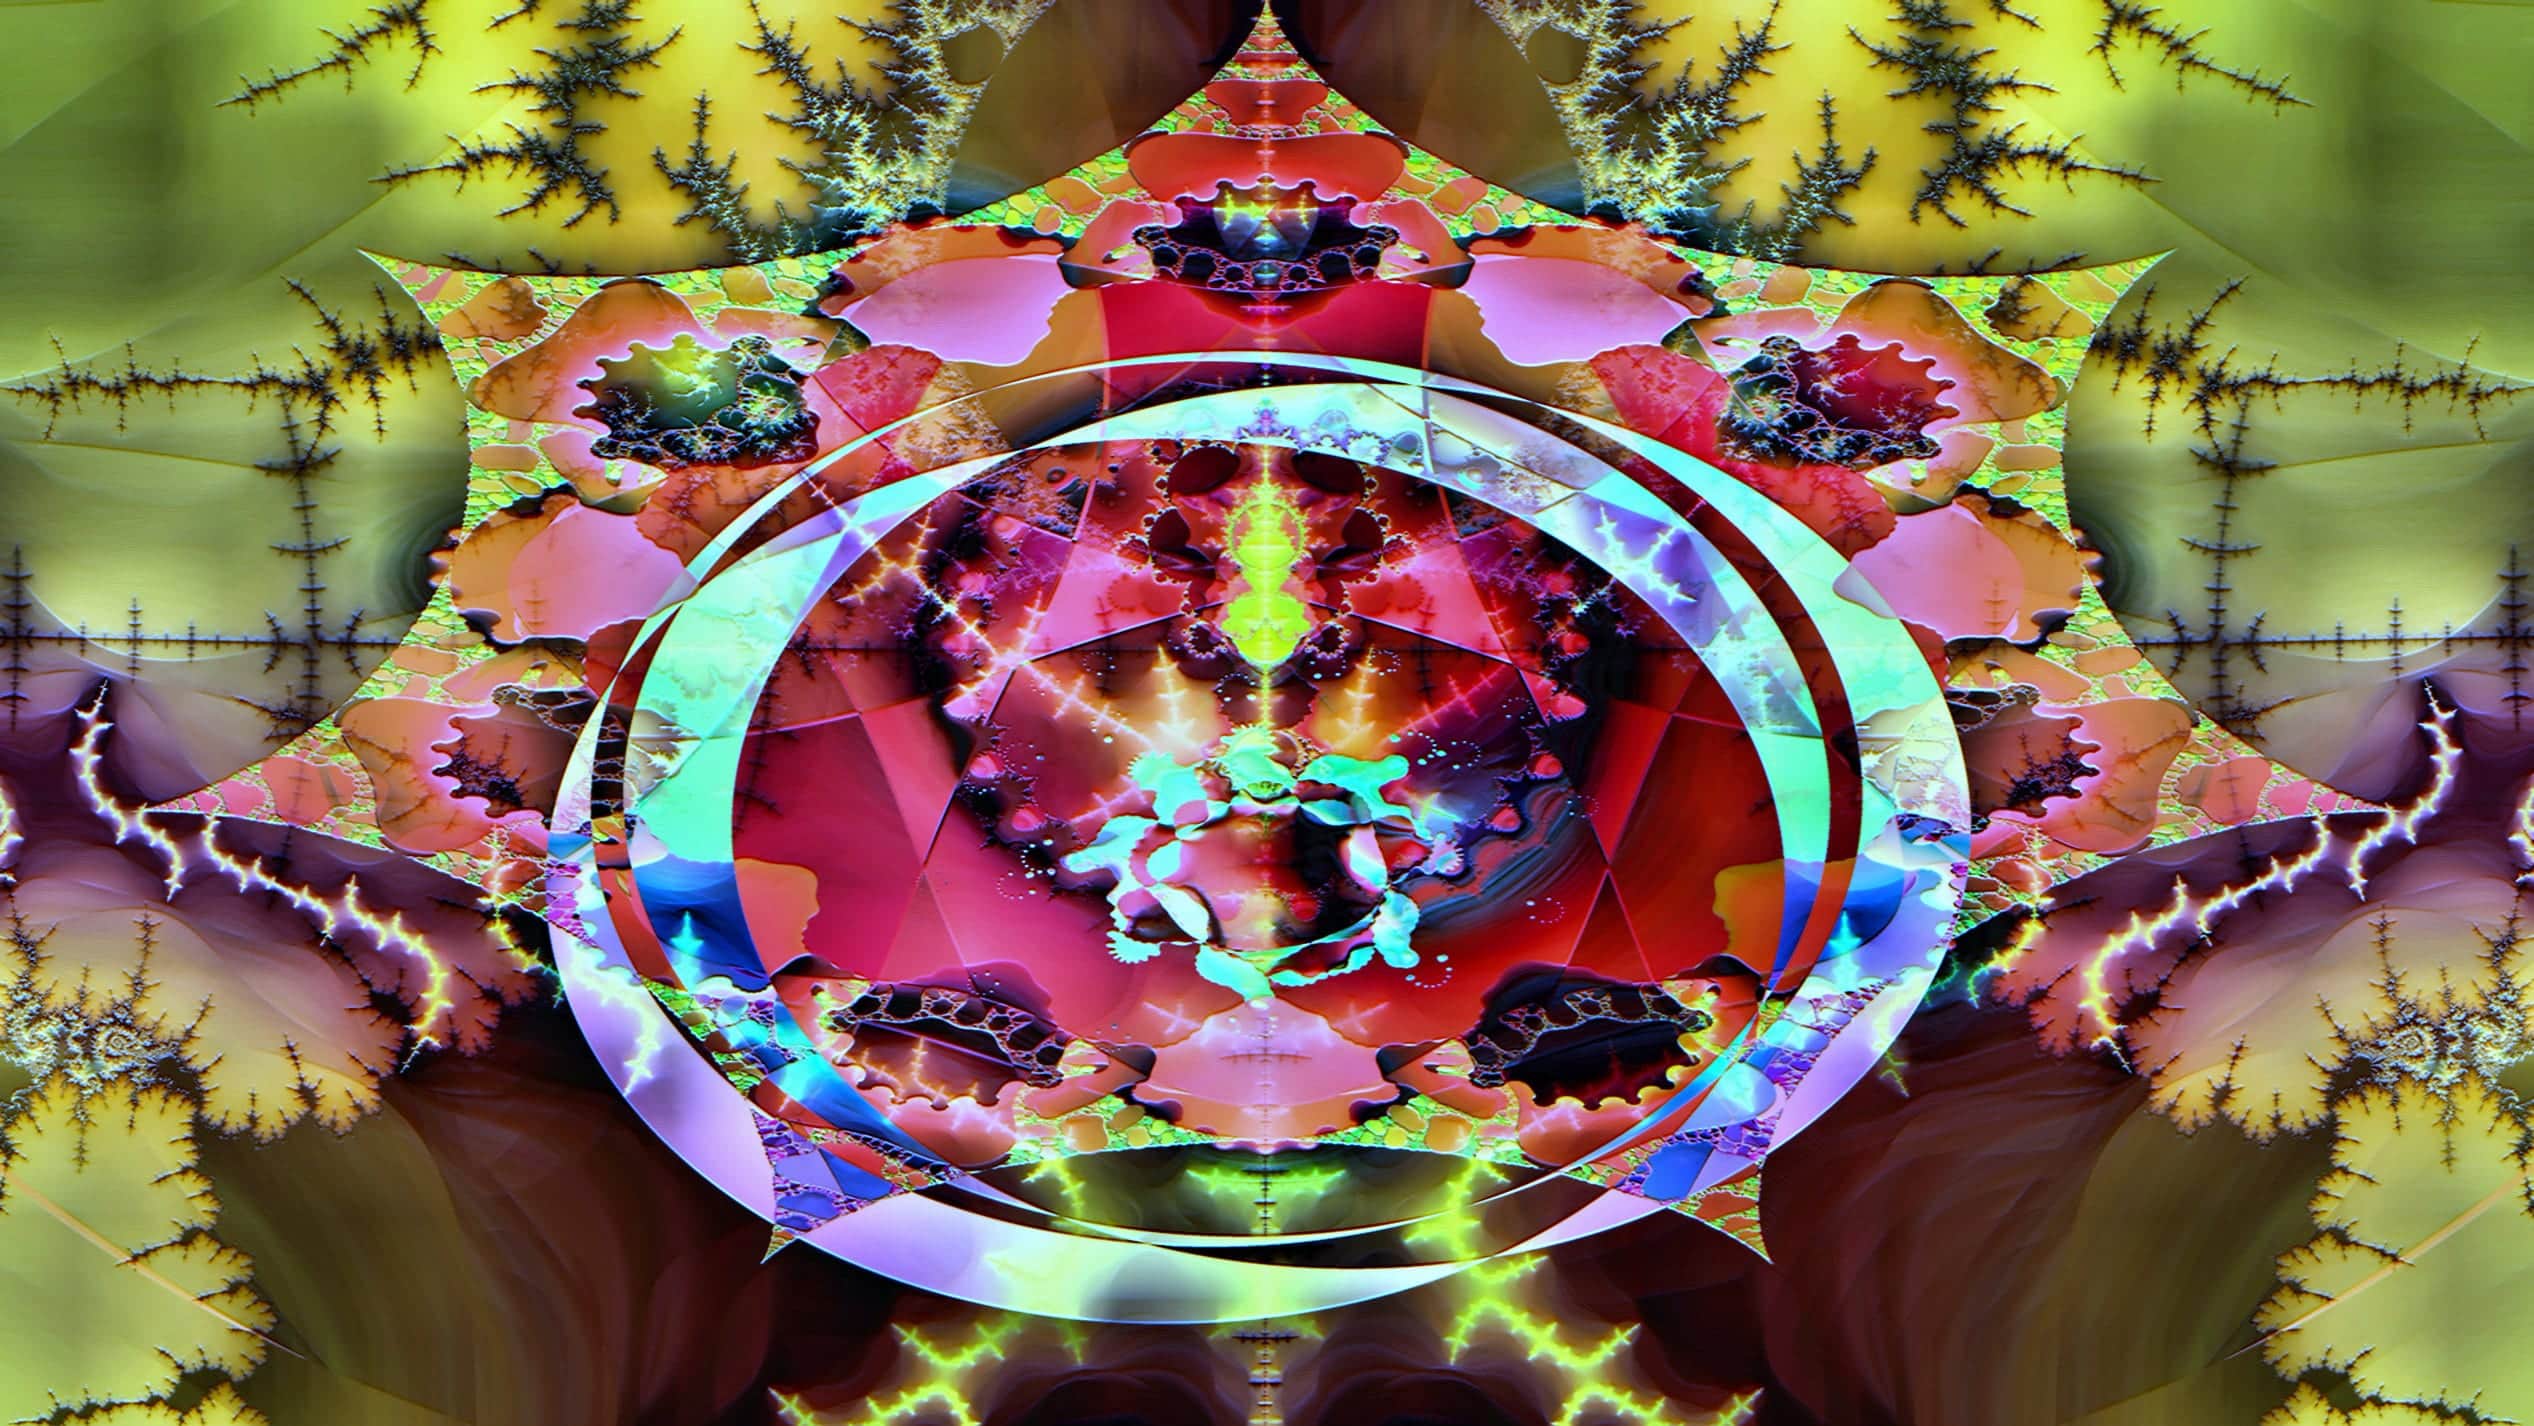
Below is this same image except upside down. Now you can see the angel at the top-middle — who guards the East gate.
Moving downstairs
And so I got called downstairs for the prayer meeting, but I had my laptop open to the Dow Stock Market with just a few minutes left until close. I watched the last few minutes downstairs. It closed down at 9.99 percent — which “upside-down” is 6.66.
And so God took His tithe (10%) in one day — the largest ‘points-drop’ ever.
It also forced all people, great and small, rich and poor, free and slave, to receive a mark on their right hands or on their foreheads, so that they could not buy or sell unless they had the mark, which is the name of the beast or the number of its name.
This calls for wisdom. Let the person who has insight calculate the number of the beast, for it is the number of a man. That number is 666. (Rev. 13:17-18)
Below is the full, but very complex, prophetic map, that I was pondering just before the Dow closed. The second is the added map. The first fractal just helps reduce congestion.

The next day, “Russel 2000” up 7.77%
We expect huge up and downswings. But of the four major Stock indexes of the United States, it is curious that the DOW was 9,99 down one day and Russel 2000 up 7.77% the very next day.
I know that this article has been disjointed. I just don’t have the time to do it justice — and I know few will read it anyway. Therefore, below is cut and paste from the related post:
Dow and TSX enter Bear Market as predicted by Prophetic Picture
“21 days” from Shebat 24th (Feb 19) to Bear Market
As discussed in earlier posts — a few days before the drop began — Shebat 24th (Feb 19th) is the date on the Jewish calendar that represents the “Times of the Gentiles”. (Feb 19/20th to March 11th/12th.)
And “21 days” (three weeks) is the number that symbolizes delay, (Daniel 10:13).
I discuss the delay number of “21” (and “210”) in combination with the date of “Shebat 24th” in the series of posts about the “Vision of the Lamb“. Below is a list of posts at that time. Note that most dates are just before Feb. 20th, when the free-fall of the Stock Market began.
The most important of these were the signs in the heavens that preceded the collapse by only one day, where I discuss at length the importance of Shebat 24th, and America and the world weighed in the balance. See, Rise and fall of the Dung god. February 18, 2020.

- 4. The Vision: God is “angry at the nations who are at ease ”February 28, 2020
- Coronavirus, Pharaoh Mubarak, and the Stock Market February 27, 2020
-
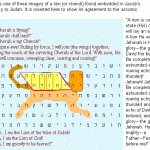
Lion Bible Code 3. Locust of Mecca & the Horn of Africa February 21, 2020 (The “Shiloh” image on Feb. 20th — “The day of soaring and roaring.”)
- Rise and fall of the Dung god February 18, 2020
- 2b. Vision of the Lamb: “Take the beam out of your own eye” February 15, 2020
- 2a. The Vision of the Lamb February 5, 2020
- 1. The Vision of Jesus Christ (& Sign of Trump) February 5, 2020
- 02/02/2020: Rare ‘worldwide palindrome day’ (& 7.7% financial quake) February 2, 2020
- Riddle of the Damned, 7.7 Cuba-earthquake, Peace Treaty January 27, 2020